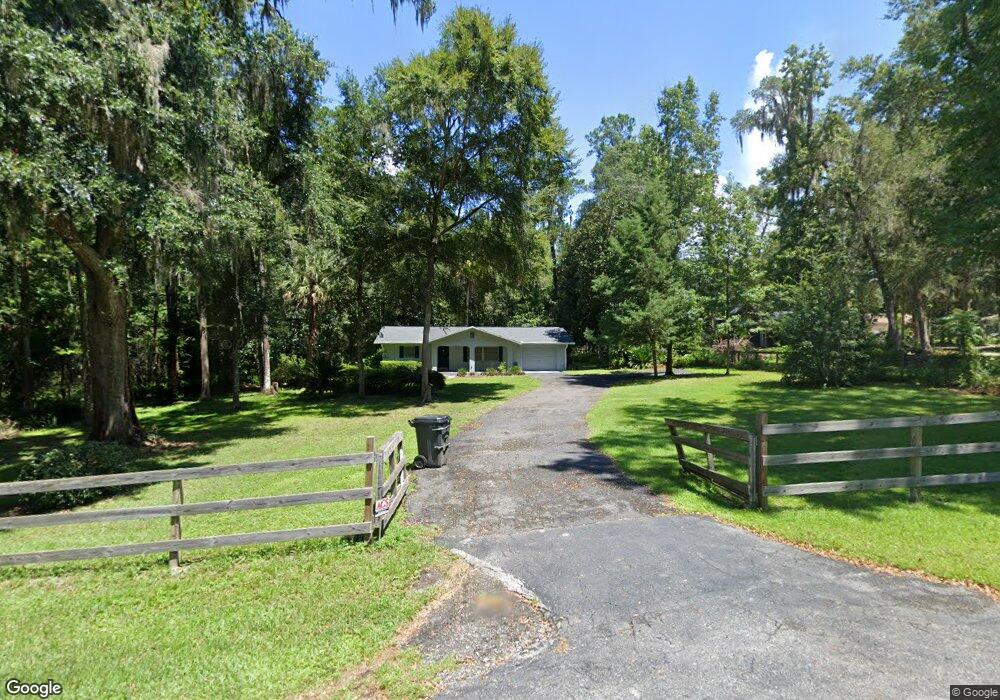
2551 SE 45th St Ocala, FL 34480
Silver Spring Shores NeighborhoodEstimated Value: $202,000 - $272,057
2
Beds
1
Bath
988
Sq Ft
$236/Sq Ft
Est. Value
About This Home
This home is located at 2551 SE 45th St, Ocala, FL 34480 and is currently estimated at $233,014, approximately $235 per square foot. 2551 SE 45th St is a home located in Marion County with nearby schools including South Ocala Elementary School, Osceola Middle School, and Forest High School.
Ownership History
Date
Name
Owned For
Owner Type
Purchase Details
Closed on
Feb 2, 2020
Sold by
Chouinard Mark E and Chouinard Mary V
Bought by
Spicochi Christine and Spicochi Revocable Living Trus
Current Estimated Value
Purchase Details
Closed on
Jul 27, 2017
Sold by
Ford Charles M and Ford Jean S
Bought by
Chouinard Mark E and Chouinard Mary V
Home Financials for this Owner
Home Financials are based on the most recent Mortgage that was taken out on this home.
Original Mortgage
$88,000
Interest Rate
3.9%
Mortgage Type
New Conventional
Purchase Details
Closed on
Apr 22, 2016
Sold by
Ford Charles M
Bought by
Ford Charles M and Ford Jean S
Purchase Details
Closed on
Apr 1, 2016
Bought by
Chouinard Mark E
Purchase Details
Closed on
Dec 22, 2004
Sold by
Ford Joan D
Bought by
Ford Joan D
Purchase Details
Closed on
Sep 8, 2000
Sold by
Ford John P and Ford Joan D
Bought by
Ford John P and Ford Joan D
Create a Home Valuation Report for This Property
The Home Valuation Report is an in-depth analysis detailing your home's value as well as a comparison with similar homes in the area
Home Values in the Area
Average Home Value in this Area
Purchase History
| Date | Buyer | Sale Price | Title Company |
|---|---|---|---|
| Spicochi Christine | -- | None Available | |
| Chouinard Mark E | $110,000 | Brick City Title Insurance A | |
| Ford Charles M | -- | Attorney | |
| Chouinard Mark E | $100 | -- | |
| Ford Joan D | -- | -- | |
| Ford John P | -- | -- |
Source: Public Records
Mortgage History
| Date | Status | Borrower | Loan Amount |
|---|---|---|---|
| Previous Owner | Chouinard Mark E | $88,000 |
Source: Public Records
Tax History Compared to Growth
Tax History
| Year | Tax Paid | Tax Assessment Tax Assessment Total Assessment is a certain percentage of the fair market value that is determined by local assessors to be the total taxable value of land and additions on the property. | Land | Improvement |
|---|---|---|---|---|
| 2024 | $3,179 | $159,410 | -- | -- |
| 2023 | $2,984 | $144,918 | $0 | $0 |
| 2022 | $2,861 | $131,744 | $0 | $0 |
| 2021 | $2,263 | $119,767 | $42,500 | $77,267 |
| 2020 | $1,061 | $85,377 | $0 | $0 |
| 2019 | $1,039 | $83,457 | $0 | $0 |
| 2018 | $991 | $81,901 | $0 | $0 |
| 2017 | $1,673 | $85,569 | $40,000 | $45,569 |
| 2016 | $1,649 | $84,188 | $0 | $0 |
| 2015 | $1,634 | $82,196 | $0 | $0 |
| 2014 | $1,536 | $80,513 | $0 | $0 |
Source: Public Records
Map
Nearby Homes
- 2406 SE 40th Street Rd
- 00 SE 41st St
- 4215 SE 24th Terrace
- 2323 SE 40th Street Rd
- 4280 SE 26th Terrace Rd
- 2881 SE 41st Place
- 3971 SE 23rd Ave
- 2375 SE 39th St
- 0 SE 45 St
- 4705 S Pine Ave
- 3070 SE 47th St
- 3060 SE 48th St
- 2921 SE 38th Place
- 4041 SE 20th Ct
- 4602 SE 19th Ave
- 5315 SE 26th Ave
- 4601 SE 18th Ave
- 0 SE 31st Terrace Unit MFROM703201
- 4001 SE 19th Ave
- 2790 SE 35th St
- 2621 SE 45th St
- 2465 SE 40th Street Rd
- 2510 SE 45th St
- 2445 SE 40th Street Rd
- 2582 SE 45th St
- 4355 SE 24th Terrace
- 4375 SE 24th Terrace
- 2641 SE 45th St
- 2450 SE 40th Street Rd
- 4325 SE 24th Terrace
- 2434 SE 40th Street Rd
- 2530 SE 41st St
- 2667 SE 45th St
- 2550 SE 41st St
- 4285 SE 24th Terrace
- 2420 SE 40th Street Rd
- 2600 SE 41st St
- 4320 SE 24th Terrace
- 4100 SE 25th Terrace
- 2650 SE 41st St