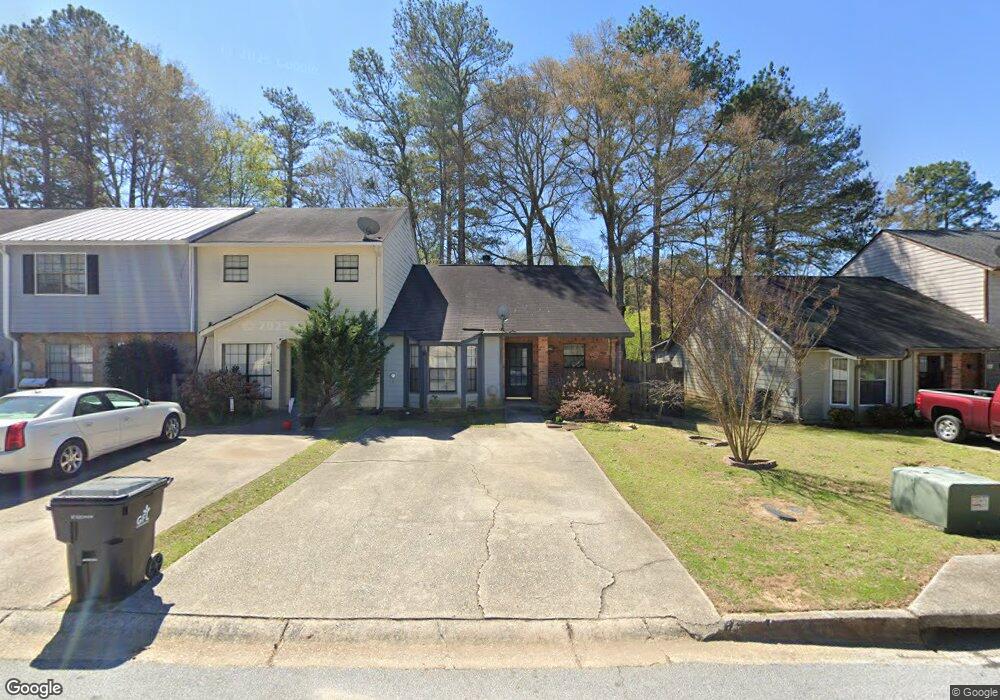
2551 Sweetridge Ct Lithia Springs, GA 30122
Lithia Springs NeighborhoodEstimated Value: $175,061 - $192,000
2
Beds
2
Baths
1,038
Sq Ft
$176/Sq Ft
Est. Value
About This Home
This home is located at 2551 Sweetridge Ct, Lithia Springs, GA 30122 and is currently estimated at $182,515, approximately $175 per square foot. 2551 Sweetridge Ct is a home located in Douglas County with nearby schools including Lithia Springs Elementary School, Turner Middle School, and Lithia Springs Comprehensive High School.
Ownership History
Date
Name
Owned For
Owner Type
Purchase Details
Closed on
Jan 11, 2019
Sold by
Booth Alison
Bought by
Turner David
Current Estimated Value
Home Financials for this Owner
Home Financials are based on the most recent Mortgage that was taken out on this home.
Original Mortgage
$48,000
Interest Rate
4.6%
Mortgage Type
Commercial
Purchase Details
Closed on
Mar 18, 1998
Sold by
Goad Emilie D
Bought by
Booth Alison
Home Financials for this Owner
Home Financials are based on the most recent Mortgage that was taken out on this home.
Original Mortgage
$44,000
Interest Rate
7.23%
Mortgage Type
New Conventional
Purchase Details
Closed on
Jul 19, 1994
Sold by
Taylor Creigh
Bought by
Goad Emilie
Home Financials for this Owner
Home Financials are based on the most recent Mortgage that was taken out on this home.
Original Mortgage
$44,500
Interest Rate
8.39%
Mortgage Type
FHA
Create a Home Valuation Report for This Property
The Home Valuation Report is an in-depth analysis detailing your home's value as well as a comparison with similar homes in the area
Home Values in the Area
Average Home Value in this Area
Purchase History
| Date | Buyer | Sale Price | Title Company |
|---|---|---|---|
| Turner David | $60,000 | -- | |
| Booth Alison | $55,000 | -- | |
| Goad Emilie | $44,900 | -- |
Source: Public Records
Mortgage History
| Date | Status | Borrower | Loan Amount |
|---|---|---|---|
| Closed | Turner David | $48,000 | |
| Previous Owner | Booth Alison | $44,000 | |
| Previous Owner | Goad Emilie | $44,500 |
Source: Public Records
Tax History Compared to Growth
Tax History
| Year | Tax Paid | Tax Assessment Tax Assessment Total Assessment is a certain percentage of the fair market value that is determined by local assessors to be the total taxable value of land and additions on the property. | Land | Improvement |
|---|---|---|---|---|
| 2024 | $1,333 | $42,360 | $5,720 | $36,640 |
| 2023 | $1,333 | $49,080 | $5,720 | $43,360 |
| 2022 | $1,103 | $33,880 | $5,200 | $28,680 |
| 2021 | $724 | $22,200 | $4,360 | $17,840 |
| 2020 | $736 | $22,200 | $4,360 | $17,840 |
| 2019 | $572 | $21,720 | $4,360 | $17,360 |
| 2018 | $560 | $21,240 | $4,360 | $16,880 |
| 2017 | $500 | $19,040 | $4,360 | $14,680 |
| 2016 | $582 | $21,360 | $5,040 | $16,320 |
| 2015 | $498 | $18,480 | $4,440 | $14,040 |
| 2014 | $426 | $16,036 | $4,160 | $11,876 |
| 2013 | -- | $16,000 | $4,160 | $11,840 |
Source: Public Records
Map
Nearby Homes
- 3403 Linda Dr
- 7104 Miller St
- 6069 Wisteria Ln
- 3340 Skyview Dr
- 7315 Lee Rd
- 3347 Skyview Dr
- 0 Miller St Unit 10574225
- 3245 W Anderson Dr
- 0 Vulcan Dr Unit 10471332
- 0 Vulcan Dr Unit 7530603
- 3476 Cooper St
- 2081 Orchid Ln
- 2102 Orchid Ln
- 545 Paces Dr
- 6717 S Sweetwater Rd
- 2741 Groovers Lake Point
- 0 W Lake Vulcan Dr Unit 10587241
- 515 Paces Dr
- 480 Paces Dr
- 2549 Sweetridge Ct
- 2553 Sweetridge Ct
- 2547 Sweetridge Ct
- 0 Sweetridge Ct Unit 7397604
- 0 Sweetridge Ct Unit 7048104
- 0 Sweetridge Ct Unit 3281405
- 0 Sweetridge Ct Unit 3272766
- 0 Sweetridge Ct Unit 3235082
- 0 Sweetridge Ct Unit 3192689
- 0 Sweetridge Ct Unit 8249243
- 0 Sweetridge Ct Unit 8236757
- 0 Sweetridge Ct Unit 7619645
- 0 Sweetridge Ct Unit 7163686
- 0 Sweetridge Ct Unit 7276485
- 0 Sweetridge Ct Unit 3218518
- 0 Sweetridge Ct Unit 8894563
- 0 Sweetridge Ct Unit 8804151
- 0 Sweetridge Ct Unit 8302007
- 0 Sweetridge Ct Unit 7594933
- 0 Sweetridge Ct Unit 7168989