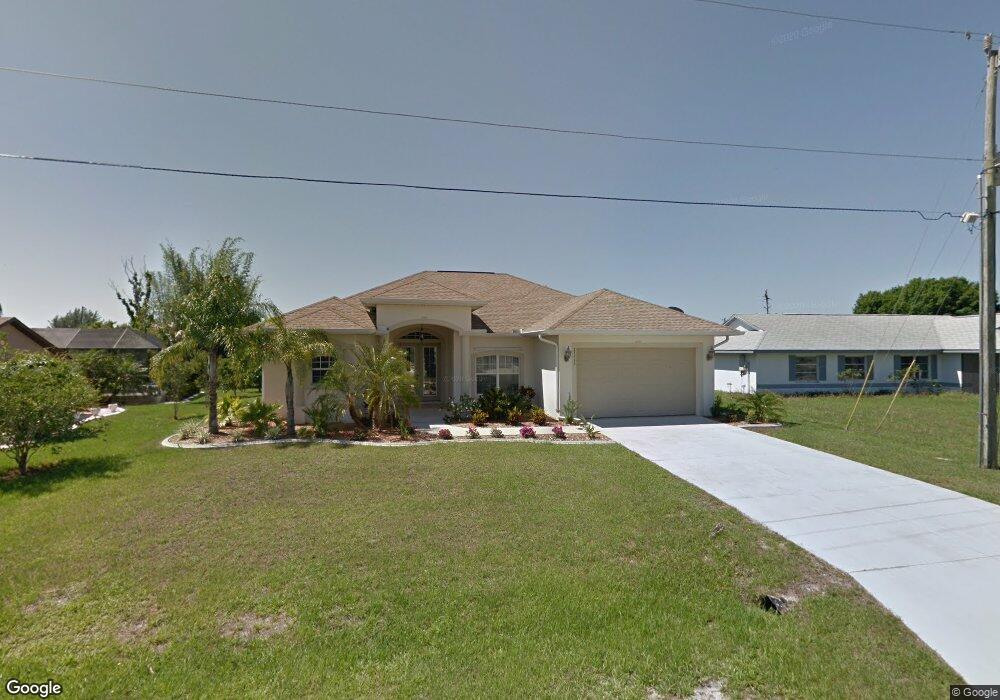
25515 Terrain Ln Unit 23 Punta Gorda, FL 33983
Deep Creek NeighborhoodEstimated Value: $381,415 - $443,000
3
Beds
2
Baths
2,022
Sq Ft
$204/Sq Ft
Est. Value
About This Home
This home is located at 25515 Terrain Ln Unit 23, Punta Gorda, FL 33983 and is currently estimated at $413,104, approximately $204 per square foot. 25515 Terrain Ln Unit 23 is a home located in Charlotte County with nearby schools including Deep Creek Elementary School, Punta Gorda Middle School, and Charlotte High School.
Ownership History
Date
Name
Owned For
Owner Type
Purchase Details
Closed on
Nov 4, 2024
Sold by
Oldroyd Lori
Bought by
Abernathy Barry L and Abernathy Pamela J
Current Estimated Value
Purchase Details
Closed on
Nov 2, 2015
Sold by
Salli Randy E and Salli Mary A
Bought by
Oldroyd Charles M and Oldroyd Lori
Purchase Details
Closed on
May 24, 2010
Sold by
Davis Glenn A and Davis Patricia A
Bought by
Salli Randy E and Salli Mary A
Home Financials for this Owner
Home Financials are based on the most recent Mortgage that was taken out on this home.
Original Mortgage
$126,400
Interest Rate
5.03%
Mortgage Type
New Conventional
Purchase Details
Closed on
May 10, 2005
Sold by
Livin Akers Robert W and Livin Robert W Akers Revocable
Bought by
Davis Glenn A and Leonard Patricia A
Purchase Details
Closed on
Sep 10, 2003
Sold by
Dudley Robert M and Dudley Patricia S
Bought by
Akers Robert W
Create a Home Valuation Report for This Property
The Home Valuation Report is an in-depth analysis detailing your home's value as well as a comparison with similar homes in the area
Home Values in the Area
Average Home Value in this Area
Purchase History
| Date | Buyer | Sale Price | Title Company |
|---|---|---|---|
| Abernathy Barry L | $435,000 | Sunbelt Title | |
| Oldroyd Charles M | $200,000 | Attorney | |
| Salli Randy E | $158,000 | Barnes Walker Title Inc | |
| Davis Glenn A | $59,700 | Equity Title Services Inc | |
| Akers Robert W | $17,900 | -- |
Source: Public Records
Mortgage History
| Date | Status | Borrower | Loan Amount |
|---|---|---|---|
| Previous Owner | Salli Randy E | $126,400 |
Source: Public Records
Tax History Compared to Growth
Tax History
| Year | Tax Paid | Tax Assessment Tax Assessment Total Assessment is a certain percentage of the fair market value that is determined by local assessors to be the total taxable value of land and additions on the property. | Land | Improvement |
|---|---|---|---|---|
| 2023 | $3,550 | $214,640 | $0 | $0 |
| 2022 | $3,382 | $208,388 | $0 | $0 |
| 2021 | $3,389 | $202,318 | $0 | $0 |
| 2020 | $3,331 | $199,525 | $0 | $0 |
| 2019 | $3,227 | $195,039 | $0 | $0 |
| 2018 | $2,986 | $191,402 | $0 | $0 |
| 2017 | $2,959 | $187,465 | $0 | $0 |
| 2016 | $2,944 | $183,609 | $0 | $0 |
| 2015 | $3,249 | $160,763 | $0 | $0 |
| 2014 | $3,077 | $154,265 | $0 | $0 |
Source: Public Records
Map
Nearby Homes
- 25518 Terrain Ln
- 1452 Wassail Ln
- 1856 Nuremberg Blvd
- 25451 Kowloon Ln
- 25463 Panache Ln
- 1767 Nuremberg Blvd
- 25407 Rupert Rd
- 1369 Vermouth Ln
- 1438 Vermouth Ln
- 1400 Vermouth Ln
- 25380 Panache Ln
- 25212 & 25220 Rampart Blvd
- 26018 Salonika Ln
- 1443 Vermouth Ln
- 1307 Tidy Ln
- 1295 Tidy Ln
- 26044 Salonika Ln
- 1342 Ultramarine Ln
- 25511 Heritage Lake Blvd Unit 8
- 1662 Nuremberg Blvd
- 25507 Terrain Ln
- 25523 Terrain Ln
- 25499 Terrain Ln
- 25529 Terrain Ln
- 25508 Terrain Ln
- 25491 Terrain Ln
- 25532 Terrain Ln
- 1444 Kedron Ln
- 1455 Kedron Ln
- 25492 Terrain Ln
- 1435 Wassail Ln
- 25483 Terrain Ln
- 1447 Wassail Ln
- 1883 Nuremberg Blvd
- 25484 Terrain Ln
- 1849 Nuremberg Blvd
- 1462 Wassail Ln
- 1841 Nuremberg Blvd
- 1917 Nuremberg Blvd
- 25498 Lacrosse Ln