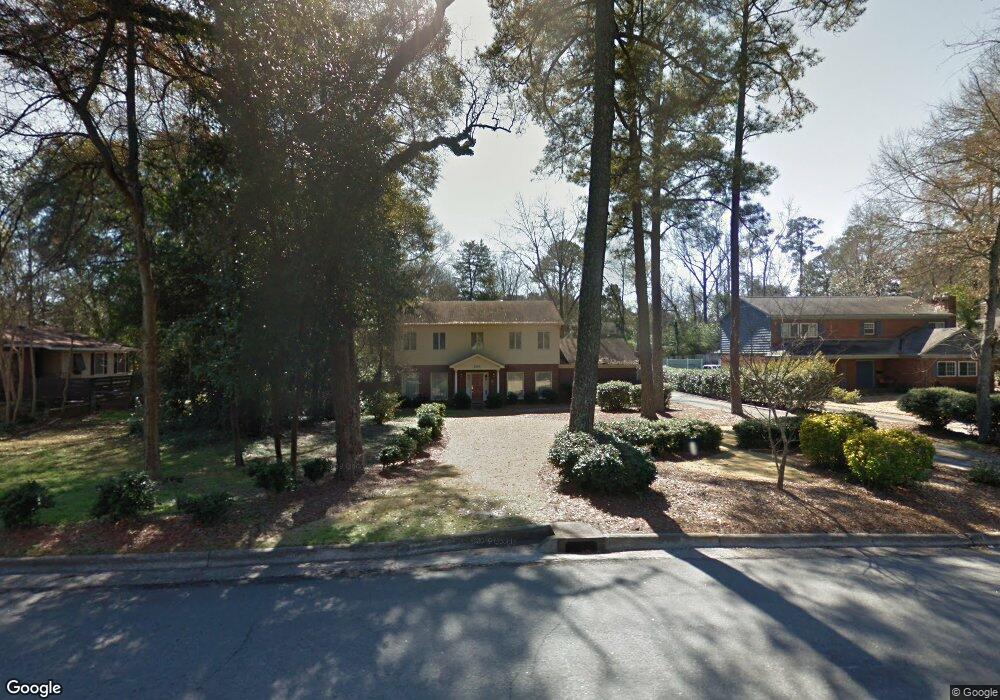
2552 17th St Columbus, GA 31906
Wynnton Grove NeighborhoodEstimated Value: $298,000 - $394,000
4
Beds
3
Baths
2,654
Sq Ft
$134/Sq Ft
Est. Value
About This Home
This home is located at 2552 17th St, Columbus, GA 31906 and is currently estimated at $355,962, approximately $134 per square foot. 2552 17th St is a home located in Muscogee County with nearby schools including Richards Middle School, Hardaway High School, and Wynnton Elementary School.
Ownership History
Date
Name
Owned For
Owner Type
Purchase Details
Closed on
Jul 6, 2023
Sold by
Brown James T
Bought by
Brown Shanell Evelyn
Current Estimated Value
Purchase Details
Closed on
Apr 22, 2019
Sold by
Cielinski Mary Jo
Bought by
Brown Shanell and Brown James T
Home Financials for this Owner
Home Financials are based on the most recent Mortgage that was taken out on this home.
Original Mortgage
$157,250
Interest Rate
4.2%
Create a Home Valuation Report for This Property
The Home Valuation Report is an in-depth analysis detailing your home's value as well as a comparison with similar homes in the area
Home Values in the Area
Average Home Value in this Area
Purchase History
| Date | Buyer | Sale Price | Title Company |
|---|---|---|---|
| Brown Shanell Evelyn | -- | None Listed On Document | |
| Brown Shanell Evelyn | -- | None Listed On Document | |
| Brown Shanell | $157,250 | -- |
Source: Public Records
Mortgage History
| Date | Status | Borrower | Loan Amount |
|---|---|---|---|
| Previous Owner | Brown Shanell | $157,250 |
Source: Public Records
Tax History
| Year | Tax Paid | Tax Assessment Tax Assessment Total Assessment is a certain percentage of the fair market value that is determined by local assessors to be the total taxable value of land and additions on the property. | Land | Improvement |
|---|---|---|---|---|
| 2025 | $195 | $128,756 | $19,512 | $109,244 |
| 2024 | $1,944 | $128,756 | $19,512 | $109,244 |
| 2023 | $1,262 | $128,756 | $19,512 | $109,244 |
| 2022 | $2,027 | $109,096 | $19,512 | $89,584 |
| 2021 | $2,021 | $99,092 | $19,512 | $79,580 |
| 2020 | $2,021 | $62,880 | $12,600 | $50,280 |
| 2019 | $1,202 | $98,024 | $19,512 | $78,512 |
| 2018 | $1,202 | $98,024 | $19,512 | $78,512 |
| 2017 | $1,208 | $98,024 | $19,512 | $78,512 |
| 2016 | $1,214 | $69,257 | $10,666 | $58,591 |
| 2015 | $1,217 | $69,257 | $10,666 | $58,591 |
| 2014 | $1,201 | $58,551 | $0 | $0 |
| 2013 | -- | $58,551 | $0 | $0 |
Source: Public Records
Map
Nearby Homes
Your Personal Tour Guide
Ask me questions while you tour the home.