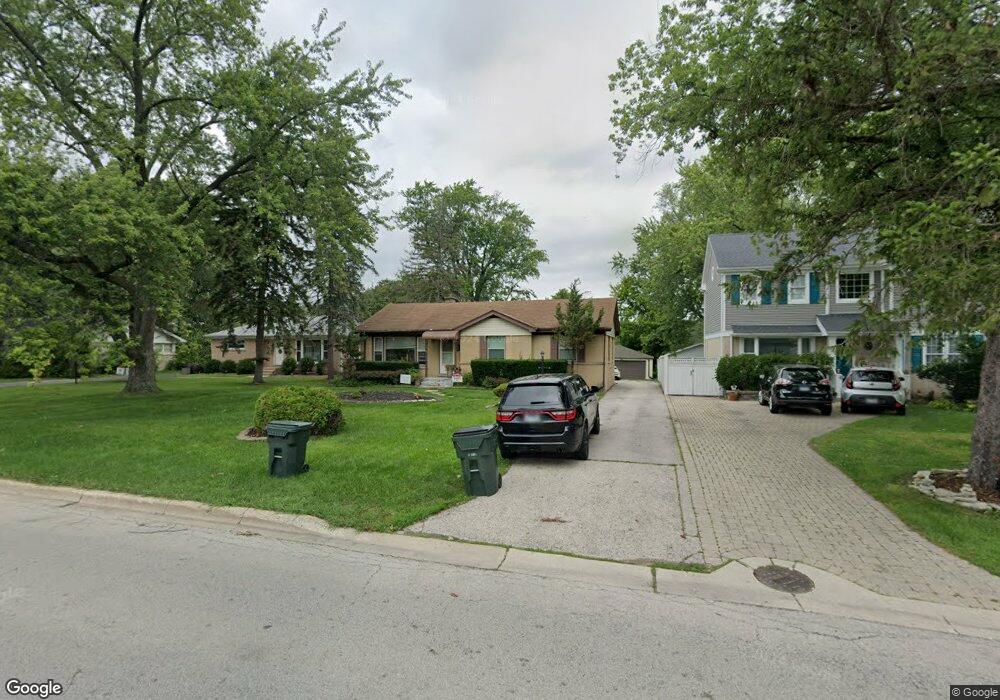
2552 Central Rd Glenview, IL 60025
Estimated Value: $494,000 - $722,000
3
Beds
1
Bath
1,572
Sq Ft
$367/Sq Ft
Est. Value
About This Home
This home is located at 2552 Central Rd, Glenview, IL 60025 and is currently estimated at $577,437, approximately $367 per square foot. 2552 Central Rd is a home located in Cook County with nearby schools including Hoffman Elementary School, Henking Elementary School, and Springman Middle School.
Ownership History
Date
Name
Owned For
Owner Type
Purchase Details
Closed on
Sep 7, 2011
Sold by
Mackinnon Marilyn M
Bought by
Pasatiempo Llc
Current Estimated Value
Home Financials for this Owner
Home Financials are based on the most recent Mortgage that was taken out on this home.
Original Mortgage
$199,000
Outstanding Balance
$136,664
Interest Rate
4.32%
Mortgage Type
Unknown
Estimated Equity
$440,773
Purchase Details
Closed on
Sep 8, 2006
Sold by
Mackinnon Marilyn M
Bought by
Mackinnon Marilyn M and Marilyn M Mackinnon Trust
Purchase Details
Closed on
Apr 6, 2005
Sold by
Mefferd Jeffrey C and Mefferd Joel T
Bought by
Mackinnon Marilyn M
Home Financials for this Owner
Home Financials are based on the most recent Mortgage that was taken out on this home.
Original Mortgage
$350,000
Interest Rate
5.89%
Mortgage Type
Fannie Mae Freddie Mac
Purchase Details
Closed on
Aug 8, 2002
Sold by
Mefferd Jeffrey C
Bought by
Mefferd Jeffrey C
Create a Home Valuation Report for This Property
The Home Valuation Report is an in-depth analysis detailing your home's value as well as a comparison with similar homes in the area
Home Values in the Area
Average Home Value in this Area
Purchase History
| Date | Buyer | Sale Price | Title Company |
|---|---|---|---|
| Pasatiempo Llc | $199,000 | Chicago Title Insurance Co | |
| Mackinnon Marilyn M | -- | None Available | |
| Mackinnon Marilyn M | $450,000 | Pntn | |
| Mefferd Jeffrey C | -- | -- |
Source: Public Records
Mortgage History
| Date | Status | Borrower | Loan Amount |
|---|---|---|---|
| Open | Pasatiempo Llc | $199,000 | |
| Previous Owner | Mackinnon Marilyn M | $350,000 |
Source: Public Records
Tax History Compared to Growth
Tax History
| Year | Tax Paid | Tax Assessment Tax Assessment Total Assessment is a certain percentage of the fair market value that is determined by local assessors to be the total taxable value of land and additions on the property. | Land | Improvement |
|---|---|---|---|---|
| 2024 | $8,632 | $39,000 | $16,269 | $22,731 |
| 2023 | $8,389 | $39,000 | $16,269 | $22,731 |
| 2022 | $8,389 | $39,000 | $16,269 | $22,731 |
| 2021 | $8,656 | $34,777 | $12,455 | $22,322 |
| 2020 | $8,553 | $34,777 | $12,455 | $22,322 |
| 2019 | $8,540 | $40,945 | $12,455 | $28,490 |
| 2018 | $8,721 | $37,921 | $10,930 | $26,991 |
| 2017 | $8,489 | $37,921 | $10,930 | $26,991 |
| 2016 | $8,021 | $37,921 | $10,930 | $26,991 |
| 2015 | $4,739 | $19,900 | $8,897 | $11,003 |
| 2014 | $4,652 | $19,900 | $8,897 | $11,003 |
| 2013 | $4,510 | $19,900 | $8,897 | $11,003 |
Source: Public Records
Map
Nearby Homes
- 2700 Fontana Dr
- 2821 Covert Rd
- 316 Nellie Ct
- 521 Michael Manor
- 517 Briarhill Ln
- 2740 Norma Ct
- 216 Flora Ave
- 203 Valerie Ct
- 137 Julie Dr
- 1088 Shermer Rd Unit DW
- 2137 Glenview Rd
- 9909 N Huber Ln
- 51 James Ct
- 2521 Gayle Ct
- 608 Glenwood Ln
- 9810 N Lauren Ln
- 315 Lincoln St
- 705 Glendale Rd
- 616 Glendale Rd
- 2121 Fir St
- 2548 Central Rd
- 2558 Central Rd
- 2540 Central Rd
- 2562 Central Rd
- 2600 Central Rd
- 2538 Central Rd
- 2545 Central Rd
- 2561 Central Rd
- 2604 Central Rd
- 2532 Central Rd
- 535 Short Ln
- 536 Short Ln
- 2539 Central Rd
- 2608 Central Rd
- 2533 Central Rd
- 527 Short Ln
- 2614 Central Rd
- 528 Short Ln
- 2529 Central Rd
- 2520 Central Rd