NOT LISTED FOR SALE

2552 Crusoe Island Dr Tybee Island, GA 31328

Estimated Value: $1,810,000

4 Beds
5 Baths
3,600 Sq Ft
$503/Sq Ft Est. Value

Last Sold October 08, 2021

Last sale price $1,900,000 $528 Per Sq Ft

Est. 5% decrease in value since last sale

Current estimated payment $11,331/month

About This Home

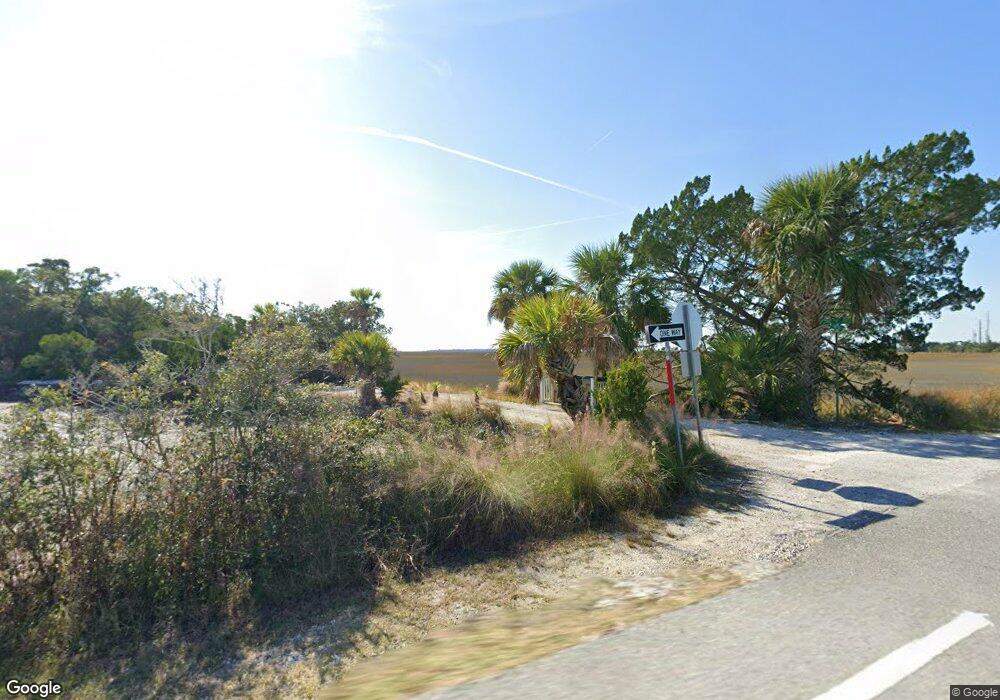
Coastal cottage, private gated island, 2+ acres with guest cottage, 4 car garage, carport, RV shed. Private deep water dock + boat lift. 50 miles of marsh/creek view. Winding shell driveway carries you through tropical island to a rocking chair cottage. 4 bedrooms + 4.5 baths could easily be 2 family home or vacation rental. All new Savannah Millworks Custom Kitchen. Stainless appliances, new cabinets, counters, laundry room, sliding doors to balcony. Den w/fireplace- open to sunroom - 2BR/2 BA can be closed off for rental or 2 family home. Endless possibilities. Work from home with vacation views. Full basement for extra storage. Screened porch. Views from every angle of this special home. Chatham County, no Tybee taxes! Secluded, private and minutes to downtown Savannah.

Ownership History

Date Name Owned For Owner Type

Purchase Details

Closed on
Dec 17, 2021
Sold by
Diversified Assessment & Therapy Service
Bought by
The Venue On Tybee Llc
Current Estimated Value
$1,810,000

Purchase Details

Closed on
Oct 8, 2021
Sold by
Gustin Barbara W
Bought by
Diversified Assessment & Therapy Service
Source: Public Records

Range of Values:

--
Value Increase
--
Percent Increase
--
Adjusted for Inflation
Collateral Analytics

Collateral Analytics Collateral Analytics AVMs (Automated Valuation Model) employ a number of statistical approaches combined with neighborhood-specific comparable selection guarantees the most up-to-date and precise valuations.

Not Available

Collateral Analytics does not have data for the current month. Please view the chart for historical values.

ICE

ICE Mortgage Technology ICE Mortgage Technology’s AVM (Automated Valuation Model) is a state-of-the-art online residential property valuation tool that provides a quick and accurate estimate of the value of almost any home in the U.S.

Not Available

ICE Mortgage Technology does not have data for the current month. Please view the chart for historical values.

First American

First American First American Data & Analytics’ next-generation AVM combines unrivaled data assets with a blended ensemble of valuation models to produce highly accurate, reliable valuations you can trust.

Not Available

First American does not have data for the current month. Please view the chart for historical values.

Quantarium

Quantarium Quantarium’s valuation service, repeatedly proven the industry’s most accurate and comprehensive, is supercharged with a self-learning and auto-tuning AI engine that continually becomes smarter and more accurate as it processes daily inputs from the industry’s leading RE data lake.

Not Available

Quantarium does not have data for the current month. Please view the chart for historical values.

Average Value
Not Available
List Price
Sold Price
Create a Home Valuation Report for This Property
The Home Valuation Report is an in-depth analysis detailing your home's value as well as a comparison with similar homes in the area

Home Values in the Area

Source: Public Records

Average Home Value in this Area


Source: Public Records

Purchase History

Date Buyer Sale Price Title Company
The Venue On Tybee Llc -- --
Diversified Assessment & Therapy Service $1,900,000 --
Source: Public Records

Property History

Date Event Price List to Sale Price per Sq Ft Prior Sale
10/08/2021 10/08/21 Sold $1,900,000 -4.8% $528 / Sq Ft View Prior Sale
07/22/2021 07/22/21 For Sale $1,995,000 -- $554 / Sq Ft

Tax History Compared to Growth

Source: Public Records

Tax History

Year Tax Paid Tax Assessment Tax Assessment Total Assessment is a certain percentage of the fair market value that is determined by local assessors to be the total taxable value of land and additions on the property. Land Improvement
2022 $9,469 $226,400 $54,400 $172,000
2021 $9,469 $179,840 $54,400 $125,440
2020 $3,522 $171,320 $54,400 $116,920
2019 $3,725 $171,320 $54,400 $116,920
2018 $3,117 $154,800 $54,400 $100,400
2017 $3,065 $117,760 $54,400 $63,360
2016 $3,107 $118,240 $54,400 $63,840
2015 $3,099 $119,480 $54,400 $65,080
2014 $4,492 $121,040 $0 $0
Source: Public Records

Agents Affiliated with this Home

  • Section Image
  • Section Image
  • Section Image
See All Agents

Map