Estimated Value: $217,000 - $269,000
4
Beds
2
Baths
1,998
Sq Ft
$123/Sq Ft
Est. Value
About This Home
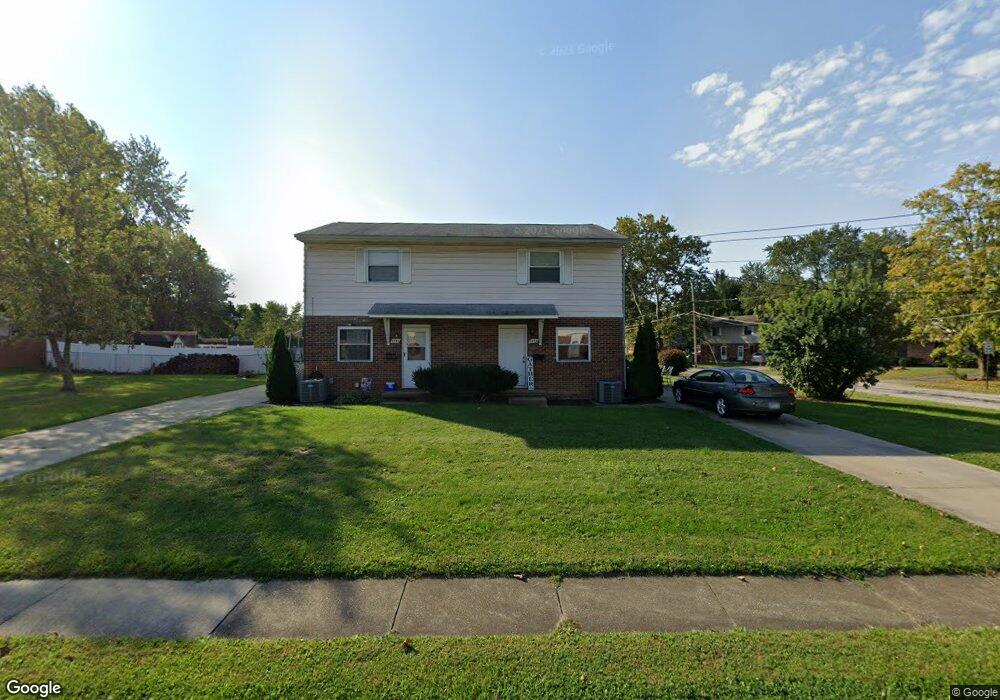
This home is located at 2552 Maplehurst Dr Unit 2556, Stow, OH 44224 and is currently estimated at $245,955, approximately $123 per square foot. 2552 Maplehurst Dr Unit 2556 is a home located in Summit County with nearby schools including Stow-Munroe Falls High School, Primrose School of Hudson, and Holy Family Elementary School.
Ownership History
Date
Name
Owned For
Owner Type
Purchase Details
Closed on
Jan 22, 2024
Sold by
Falletta Juliette and Falletta Charles
Bought by
Falletta Properties Llc
Current Estimated Value
Purchase Details
Closed on
Sep 18, 2018
Sold by
Vizmeg Joseph
Bought by
Vizmeg Joe R and Falletta Juliet
Purchase Details
Closed on
Nov 17, 2017
Sold by
Vizmeg Joseph and Vizmeg Katalin
Bought by
Vizmeg Joseph
Purchase Details
Closed on
Jun 24, 2014
Sold by
Jaskula Danielle
Bought by
Piacquadio Joseph V and Piacquadio Diane M
Purchase Details
Closed on
Feb 7, 2014
Sold by
Berg Martin W
Bought by
Jaskula Danielle
Purchase Details
Closed on
Aug 19, 2011
Sold by
Berg Martin W
Bought by
Berg Martin W
Purchase Details
Closed on
Aug 18, 2011
Sold by
Berg Martin W
Bought by
Berg Martin W and Martin W Berg Revocable Living Trust
Create a Home Valuation Report for This Property
The Home Valuation Report is an in-depth analysis detailing your home's value as well as a comparison with similar homes in the area
Home Values in the Area
Average Home Value in this Area
Purchase History
| Date | Buyer | Sale Price | Title Company |
|---|---|---|---|
| Falletta Properties Llc | -- | None Listed On Document | |
| Vizmeg Joe R | -- | None Available | |
| Vizmeg Joseph | -- | None Available | |
| Piacquadio Joseph V | $28,850 | None Available | |
| Jaskula Danielle | $144,000 | None Available | |
| Berg Martin W | -- | None Available | |
| Berg Martin W | -- | Attorney | |
| Berg Martin W | -- | Attorney |
Source: Public Records
Tax History Compared to Growth
Tax History
| Year | Tax Paid | Tax Assessment Tax Assessment Total Assessment is a certain percentage of the fair market value that is determined by local assessors to be the total taxable value of land and additions on the property. | Land | Improvement |
|---|---|---|---|---|
| 2025 | $3,577 | $60,491 | $13,853 | $46,638 |
| 2024 | $3,577 | $60,491 | $13,853 | $46,638 |
| 2023 | $3,577 | $60,491 | $13,853 | $46,638 |
| 2022 | $3,061 | $45,483 | $10,416 | $35,067 |
| 2021 | $2,757 | $45,483 | $10,416 | $35,067 |
| 2020 | $2,712 | $45,490 | $10,420 | $35,070 |
| 2019 | $2,652 | $41,540 | $10,420 | $31,120 |
| 2018 | $2,611 | $41,540 | $10,420 | $31,120 |
| 2017 | $2,851 | $41,540 | $10,420 | $31,120 |
| 2016 | $2,528 | $38,660 | $10,420 | $28,240 |
| 2015 | $2,851 | $38,660 | $10,420 | $28,240 |
| 2014 | $2,521 | $38,840 | $10,420 | $28,420 |
| 2013 | $3,286 | $50,560 | $10,420 | $40,140 |
Source: Public Records
Map
Nearby Homes
- 4227 Baird Rd
- 4131 Burton Dr
- 4621 Graford Ln
- 2418 Wrens Dr S Unit G
- 4903 Fishcreek Rd Unit 11B
- 4901 Independence Cir Unit B
- 2410 Liberty Rd
- 2755 Laurel Woods Blvd
- 4917 Independence Cir Unit B
- 4120 Klein Ave
- 0 Stow Rd Unit 5102979
- 2140 Woodlawn Cir Unit 2144
- 2380 Port Williams Dr Unit 2380
- 0 Vira Rd
- 3961 Klein Ave
- 4731 Haughton Ct
- 2140 Uniondale Dr
- 2327 Crockett Cir
- 4035 Villas Dr
- 2028 Willowdale Dr
- 2556 Maplehurst Dr
- 4423 Cherryhurst Dr Unit 4427
- 4427 Cherryhurst Dr
- 2562 Maplehurst Dr
- 4419 Cherryhurst Dr
- 2551 Maplehurst Dr Unit 2555
- 2557 Maplehurst Dr Unit 2561
- 4415 Cherryhurst Dr Unit 4419
- 2528 Maplehurst Dr Unit 2532
- 4434 Cherryhurst Dr
- 2547 Maplehurst Dr
- 4430 Cherryhurst Dr Unit 4434
- 2543 Maplehurst Dr Unit 2547
- 3940 Fishcreek Rd
- 39 Fishcreek Rd
- 0 Fishcreek Rd
- 4422 Cherryhurst Dr Unit 4426
- 4411 Cherryhurst Dr
- 2539 Maplehurst Dr
- 4658 Fishcreek Rd