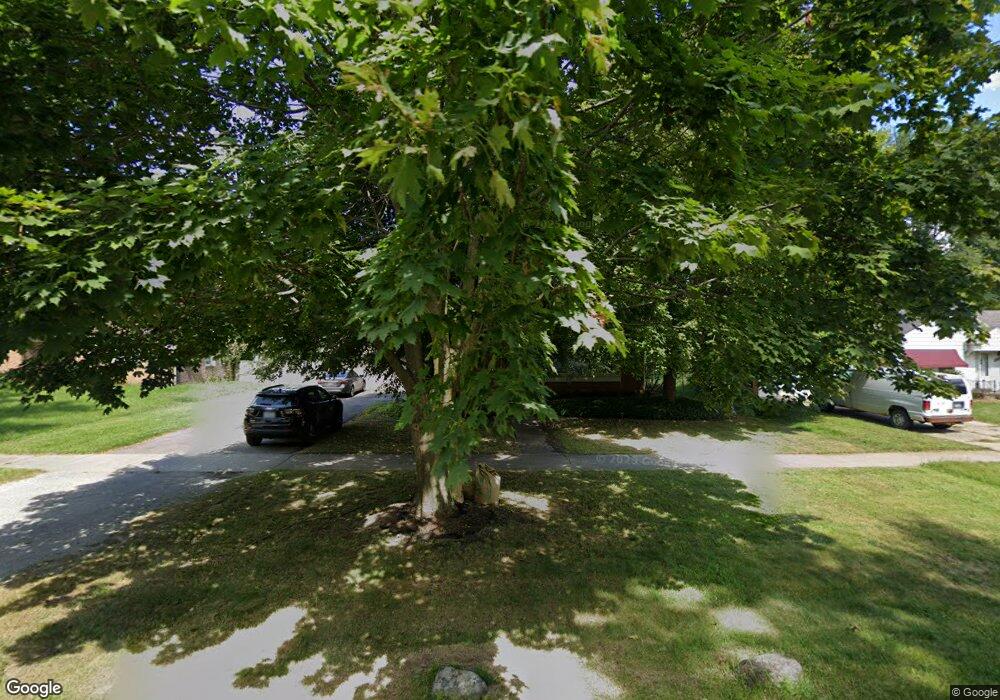
25522 Lyndon Unit Bldg-Unit Redford, MI 48239
Estimated Value: $249,982 - $294,000
3
Beds
2
Baths
1,521
Sq Ft
$182/Sq Ft
Est. Value
About This Home
This home is located at 25522 Lyndon Unit Bldg-Unit, Redford, MI 48239 and is currently estimated at $276,496, approximately $181 per square foot. 25522 Lyndon Unit Bldg-Unit is a home located in Wayne County with nearby schools including John D. Pierce Middle School, Lee M. Thurston High School, and Detroit Leadership Academy.
Ownership History
Date
Name
Owned For
Owner Type
Purchase Details
Closed on
Mar 28, 2024
Sold by
Lynem Akima S
Bought by
Bates Ardana Denise
Current Estimated Value
Home Financials for this Owner
Home Financials are based on the most recent Mortgage that was taken out on this home.
Original Mortgage
$245,471
Interest Rate
6.82%
Mortgage Type
FHA
Purchase Details
Closed on
Jun 27, 2018
Sold by
Brian Richardson Amelia and Brian Gradinsenk
Bought by
Lynem Akima S
Purchase Details
Closed on
Mar 19, 2010
Sold by
Scott Bailey Lisa M and Bailey John W
Bought by
Richardson Amelia and Gradinscak Brian
Purchase Details
Closed on
Sep 26, 1994
Sold by
David B Kata
Bought by
Lynn M Caurdy
Home Financials for this Owner
Home Financials are based on the most recent Mortgage that was taken out on this home.
Original Mortgage
$88,548
Interest Rate
8.55%
Mortgage Type
FHA
Create a Home Valuation Report for This Property
The Home Valuation Report is an in-depth analysis detailing your home's value as well as a comparison with similar homes in the area
Home Values in the Area
Average Home Value in this Area
Purchase History
| Date | Buyer | Sale Price | Title Company |
|---|---|---|---|
| Bates Ardana Denise | $250,000 | Regions Title | |
| Bates Ardana Denise | $250,000 | Regions Title | |
| Lynem Akima S | $175,000 | None Available | |
| Richardson Amelia | $73,500 | Homeland Title & Escrow Agen | |
| Lynn M Caurdy | $89,000 | -- |
Source: Public Records
Mortgage History
| Date | Status | Borrower | Loan Amount |
|---|---|---|---|
| Previous Owner | Bates Ardana Denise | $245,471 | |
| Previous Owner | Lynn M Caurdy | $88,548 |
Source: Public Records
Tax History Compared to Growth
Tax History
| Year | Tax Paid | Tax Assessment Tax Assessment Total Assessment is a certain percentage of the fair market value that is determined by local assessors to be the total taxable value of land and additions on the property. | Land | Improvement |
|---|---|---|---|---|
| 2025 | $1,569 | $103,700 | $0 | $0 |
| 2024 | $1,569 | $97,900 | $0 | $0 |
| 2023 | $1,503 | $88,000 | $0 | $0 |
| 2022 | $4,215 | $78,400 | $0 | $0 |
| 2021 | $4,096 | $73,000 | $0 | $0 |
| 2020 | $4,037 | $64,100 | $0 | $0 |
| 2019 | $3,947 | $60,100 | $0 | $0 |
| 2018 | $927 | $52,400 | $0 | $0 |
| 2017 | $3,206 | $48,800 | $0 | $0 |
| 2016 | $2,498 | $47,400 | $0 | $0 |
| 2015 | $3,892 | $43,400 | $0 | $0 |
| 2013 | $3,770 | $38,500 | $0 | $0 |
| 2012 | $2,181 | $42,600 | $11,000 | $31,600 |
Source: Public Records
Map
Nearby Homes
- 13949 Farley
- 14355 Brady
- 25587 Ivanhoe
- 26235 Ross Dr
- 14910 Aubrey
- 15028 Sumner
- 15034 Sumner
- 24777 Ashley Ct Unit 5
- 15048 Beech Daly Rd
- 14248 Dixie
- 15067 Sumner
- 24790 Ashley Ct Unit 23
- 13973 Dixie
- 14041 Minock Dr
- 24629 Westgate Dr
- 26561 Kendall Ct
- 13965 Minock Dr
- 24516 Lyndon
- 12845 Centralia
- 25301 5 Mile Rd Unit 109