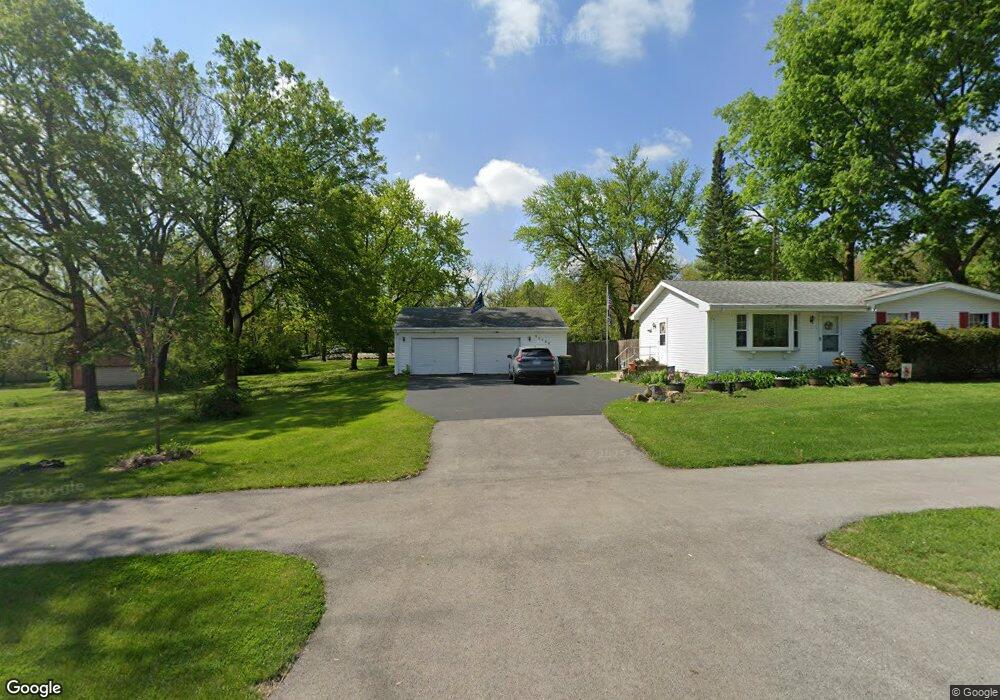
25525 W Bridge St Channahon, IL 60410
South DuPage River NeighborhoodEstimated Value: $219,433 - $318,000
3
Beds
--
Bath
1,012
Sq Ft
$274/Sq Ft
Est. Value
About This Home
This home is located at 25525 W Bridge St, Channahon, IL 60410 and is currently estimated at $277,358, approximately $274 per square foot. 25525 W Bridge St is a home located in Will County with nearby schools including N B Galloway Elementary School, Pioneer Path School, and Three Rivers School.
Ownership History
Date
Name
Owned For
Owner Type
Purchase Details
Closed on
Dec 2, 2002
Sold by
Froemel Gerald A and Froemel Agnes A
Bought by
Harris George F and Harris Janis L
Current Estimated Value
Home Financials for this Owner
Home Financials are based on the most recent Mortgage that was taken out on this home.
Original Mortgage
$106,500
Outstanding Balance
$46,207
Interest Rate
6.38%
Estimated Equity
$231,151
Create a Home Valuation Report for This Property
The Home Valuation Report is an in-depth analysis detailing your home's value as well as a comparison with similar homes in the area
Home Values in the Area
Average Home Value in this Area
Purchase History
| Date | Buyer | Sale Price | Title Company |
|---|---|---|---|
| Harris George F | $156,500 | -- |
Source: Public Records
Mortgage History
| Date | Status | Borrower | Loan Amount |
|---|---|---|---|
| Open | Harris George F | $106,500 |
Source: Public Records
Tax History
| Year | Tax Paid | Tax Assessment Tax Assessment Total Assessment is a certain percentage of the fair market value that is determined by local assessors to be the total taxable value of land and additions on the property. | Land | Improvement |
|---|---|---|---|---|
| 2024 | $3,483 | $57,304 | $15,345 | $41,959 |
| 2023 | $3,483 | $58,453 | $13,526 | $44,927 |
| 2022 | $3,769 | $54,819 | $12,685 | $42,134 |
| 2021 | $3,488 | $51,814 | $11,990 | $39,824 |
| 2020 | $3,367 | $50,699 | $11,732 | $38,967 |
| 2019 | $3,175 | $48,400 | $11,200 | $37,200 |
| 2018 | $3,038 | $46,619 | $10,325 | $36,294 |
| 2017 | $2,936 | $44,697 | $9,899 | $34,798 |
| 2016 | $2,815 | $43,838 | $9,500 | $34,338 |
| 2015 | $3,070 | $41,200 | $8,500 | $32,700 |
| 2014 | $3,070 | $40,700 | $8,500 | $32,200 |
| 2013 | $3,070 | $40,700 | $8,500 | $32,200 |
Source: Public Records
Map
Nearby Homes
- 25530 S Canal St
- 25710 S Parkside Dr
- 25253 Forest Edge Dr
- 25010 S Canal St
- 25127 S Tryon St
- 24802 S Elsie St
- 26160 W Ravine Woods Dr
- 25624 S Fieldstone Ct
- 25715 W Cherokee Trail
- 26525 W Stephanie Dr
- 26421 W Fox Trail
- 26334 W Silver Stream Dr
- 26010 W Airport Rd
- 25225 W Saint Elizabeth Dr Unit B32
- 25221 W Saint Elizabeth Dr Unit B33
- 25215 W Saint Elizabeth Dr Unit B34
- 25211 W Saint Elizabeth Dr Unit B35
- 26140 S Bell Rd
- 428 E Frontier Dr
- 25205 W Saint Elizabeth Dr Unit B36
- 25517 W Bridge St
- 25535 W Bridge St
- 25505 W Bridge St
- 25550 W Bridge St
- 25501 S Parkside Dr
- 25538 W Bridge St
- 25516 W Bridge St
- 25527 W Bridge St
- 25461 W Bridge St
- 25544 W Bridge St
- 25558 W Bridge St
- 25410 S Cherry St
- 25549 S May St
- 25548 W Bridge St
- 25553 S May Ct
- 25552 W Bridge St
- 25451 W Bridge St
- 25611 W Bridge St
- 25502 S Parkside Dr
- 25562 W Bridge St
Your Personal Tour Guide
Ask me questions while you tour the home.