Estimated Value: $175,990 - $188,000
3
Beds
1
Bath
1,084
Sq Ft
$168/Sq Ft
Est. Value
About This Home
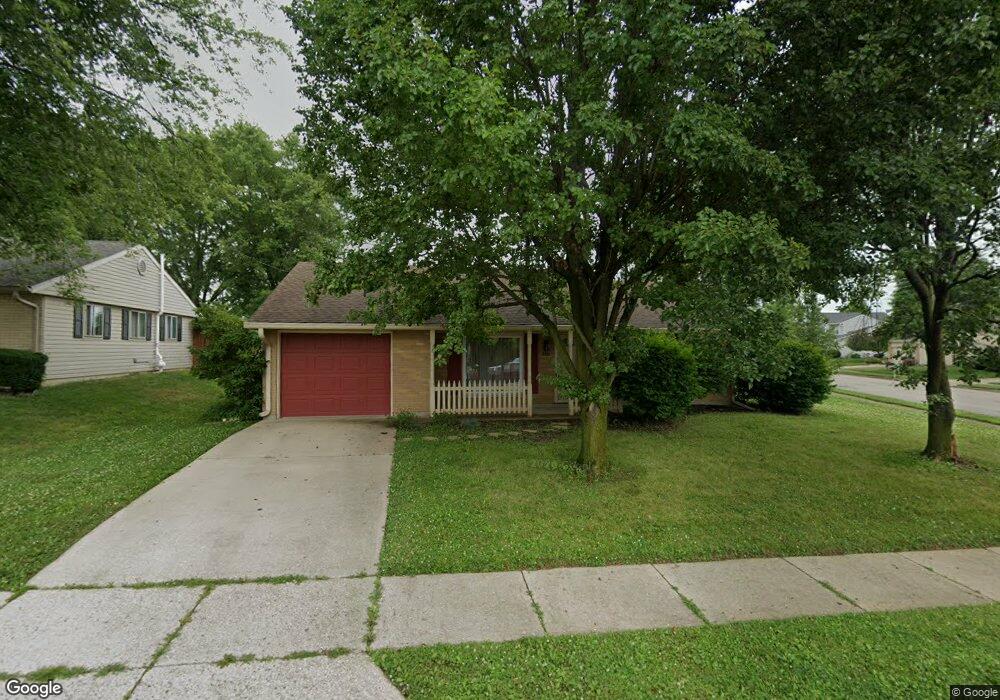
This home is located at 2553 Cornwall Dr, Xenia, OH 45385 and is currently estimated at $182,248, approximately $168 per square foot. 2553 Cornwall Dr is a home located in Greene County with nearby schools including Xenia High School and Summit Academy Community School for Alternative Learners - Xenia.
Ownership History
Date
Name
Owned For
Owner Type
Purchase Details
Closed on
May 10, 2024
Sold by
Long Chadwick E and Long Angela
Bought by
Shinkle Caden D
Current Estimated Value
Home Financials for this Owner
Home Financials are based on the most recent Mortgage that was taken out on this home.
Original Mortgage
$151,210
Outstanding Balance
$144,606
Interest Rate
7.25%
Mortgage Type
FHA
Estimated Equity
$37,642
Purchase Details
Closed on
Apr 15, 2024
Sold by
Thomas Melanie M
Bought by
Long Chadwick E
Home Financials for this Owner
Home Financials are based on the most recent Mortgage that was taken out on this home.
Original Mortgage
$151,210
Outstanding Balance
$144,606
Interest Rate
7.25%
Mortgage Type
FHA
Estimated Equity
$37,642
Purchase Details
Closed on
Nov 29, 2017
Bought by
Thomas Melanie M
Create a Home Valuation Report for This Property
The Home Valuation Report is an in-depth analysis detailing your home's value as well as a comparison with similar homes in the area
Home Values in the Area
Average Home Value in this Area
Purchase History
| Date | Buyer | Sale Price | Title Company |
|---|---|---|---|
| Shinkle Caden D | $154,000 | Home Services Title | |
| Long Chadwick E | -- | None Listed On Document | |
| Thomas Melanie M | -- | -- |
Source: Public Records
Mortgage History
| Date | Status | Borrower | Loan Amount |
|---|---|---|---|
| Open | Shinkle Caden D | $151,210 |
Source: Public Records
Tax History
| Year | Tax Paid | Tax Assessment Tax Assessment Total Assessment is a certain percentage of the fair market value that is determined by local assessors to be the total taxable value of land and additions on the property. | Land | Improvement |
|---|---|---|---|---|
| 2025 | $1,921 | $44,110 | $12,160 | $31,950 |
| 2024 | $1,921 | $44,110 | $12,160 | $31,950 |
| 2023 | $1,887 | $44,110 | $12,160 | $31,950 |
| 2022 | $1,553 | $30,960 | $7,150 | $23,810 |
| 2021 | $1,574 | $30,960 | $7,150 | $23,810 |
| 2020 | $1,508 | $30,960 | $7,150 | $23,810 |
| 2019 | $1,305 | $25,210 | $7,050 | $18,160 |
| 2018 | $1,310 | $25,210 | $7,050 | $18,160 |
| 2017 | $719 | $25,210 | $7,050 | $18,160 |
| 2016 | $720 | $22,720 | $7,050 | $15,670 |
| 2015 | $1,174 | $22,720 | $7,050 | $15,670 |
| 2014 | $1,123 | $22,720 | $7,050 | $15,670 |
Source: Public Records
Map
Nearby Homes
- 0 Berkshire Dr Unit 949217
- 2352 Pembury Dr
- 1321 Massachusetts Dr
- 2813 Raxit Ct
- 1955 Roxbury Dr
- 2936 W Barnhill Place
- 1001 Glen Kegley Dr
- 938 Wright Ave
- 2238 Tandem Dr
- 1254 Prem Place
- 2096 Alabama Dr
- 1299 Baybury Ave
- 1298 Baybury Ave
- 1198 Prem Place
- 1282 Baybury Ave
- 2102 High Wheel Dr
- 2795 Kingman Dr
- 1265 Baybury Ave
- 920 Wright Cycle Blvd
- 926 Wright Cycle Blvd
- 1349 Berkshire Dr
- 2539 Cornwall Dr
- 2525 Cornwall Dr
- 1340 Berkshire Dr
- 1356 Berkshire Dr
- 1332 Berkshire Dr
- 2511 Cornwall Dr
- 1364 Berkshire Dr
- 2526 Cornwall Dr
- 1372 Berkshire Dr
- 2512 Cornwall Dr
- 1323 Berkshire Dr
- 1324 Berkshire Dr
- 2497 Cornwall Dr
- 2173 Windsor Dr
- 2159 Windsor Dr
- 1380 Berkshire Dr
- 2498 Cornwall Dr
- 1315 Berkshire Dr
- 2145 Windsor Dr
Your Personal Tour Guide
Ask me questions while you tour the home.