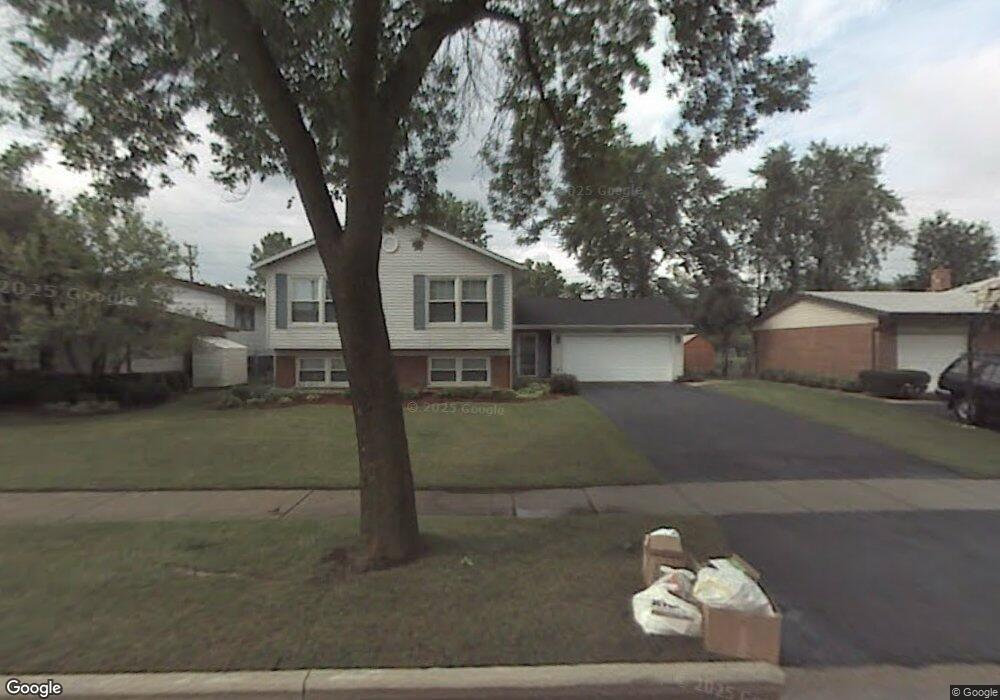
2554 N Ridge Ave Unit 6 Arlington Heights, IL 60004
Berkley Square NeighborhoodEstimated Value: $421,000 - $519,000
4
Beds
2
Baths
1,314
Sq Ft
$360/Sq Ft
Est. Value
About This Home
This home is located at 2554 N Ridge Ave Unit 6, Arlington Heights, IL 60004 and is currently estimated at $473,359, approximately $360 per square foot. 2554 N Ridge Ave Unit 6 is a home located in Cook County with nearby schools including Ivy Hill Elementary School, Thomas Middle School, and Buffalo Grove High School.
Ownership History
Date
Name
Owned For
Owner Type
Purchase Details
Closed on
Dec 4, 2020
Sold by
Warden Maripat F
Bought by
Warden Maripat F
Current Estimated Value
Purchase Details
Closed on
Mar 9, 2018
Sold by
Warden David J and Warden Maripat F
Bought by
Warden Maripat F
Home Financials for this Owner
Home Financials are based on the most recent Mortgage that was taken out on this home.
Original Mortgage
$215,000
Outstanding Balance
$181,405
Interest Rate
3.75%
Mortgage Type
Adjustable Rate Mortgage/ARM
Estimated Equity
$291,954
Purchase Details
Closed on
Jun 26, 1998
Sold by
Dimucci John
Bought by
Warden David J and Warden Maripat F
Home Financials for this Owner
Home Financials are based on the most recent Mortgage that was taken out on this home.
Original Mortgage
$155,000
Interest Rate
7.17%
Purchase Details
Closed on
Aug 30, 1995
Sold by
Wagner Wayne P and Wagner Lynn L
Bought by
Dimucci John
Home Financials for this Owner
Home Financials are based on the most recent Mortgage that was taken out on this home.
Original Mortgage
$161,000
Interest Rate
7.55%
Create a Home Valuation Report for This Property
The Home Valuation Report is an in-depth analysis detailing your home's value as well as a comparison with similar homes in the area
Home Values in the Area
Average Home Value in this Area
Purchase History
| Date | Buyer | Sale Price | Title Company |
|---|---|---|---|
| Warden Maripat F | -- | Silk Abstract Company | |
| Warden Maripat F | -- | Chicago Title | |
| Warden David J | $240,000 | -- | |
| Dimucci John | $161,000 | -- |
Source: Public Records
Mortgage History
| Date | Status | Borrower | Loan Amount |
|---|---|---|---|
| Open | Warden Maripat F | $215,000 | |
| Closed | Warden David J | $155,000 | |
| Previous Owner | Dimucci John | $161,000 |
Source: Public Records
Tax History Compared to Growth
Tax History
| Year | Tax Paid | Tax Assessment Tax Assessment Total Assessment is a certain percentage of the fair market value that is determined by local assessors to be the total taxable value of land and additions on the property. | Land | Improvement |
|---|---|---|---|---|
| 2024 | $8,191 | $33,235 | $7,875 | $25,360 |
| 2023 | $8,854 | $33,235 | $7,875 | $25,360 |
| 2022 | $8,854 | $37,000 | $7,875 | $29,125 |
| 2021 | $7,090 | $26,884 | $5,031 | $21,853 |
| 2020 | $6,974 | $26,884 | $5,031 | $21,853 |
| 2019 | $6,934 | $29,839 | $5,031 | $24,808 |
| 2018 | $6,831 | $26,844 | $4,375 | $22,469 |
| 2017 | $7,582 | $29,668 | $4,375 | $25,293 |
| 2016 | $7,308 | $29,668 | $4,375 | $25,293 |
| 2015 | $6,305 | $23,978 | $3,718 | $20,260 |
| 2014 | $6,137 | $23,978 | $3,718 | $20,260 |
| 2013 | $5,966 | $23,978 | $3,718 | $20,260 |
Source: Public Records
Map
Nearby Homes
- 2522 N Chestnut Ave
- 601 W Rand Rd Unit 207
- 215 W Hintz Rd
- 2426 N Kennicott Dr Unit 1B
- 910 W Alleghany Dr Unit 2A
- 2410 N Kennicott Dr Unit 2D
- 2340 N Lafayette St
- 2315 N Arlington Heights Rd
- 2020 N Chestnut Ave
- 803 W Burr Oak Dr
- 2100 N Ridge Rd
- 504 E Sunset Dr
- 1507 W Plymouth Dr
- 1825 N Kaspar Ave
- 25 E Palatine Rd Unit 207
- 25 E Palatine Rd Unit 303
- 1225 Radcliffe Rd Unit 2
- 461 N Jonathan Dr Unit 461202
- 3222 N Heritage Ln
- 3227 N Heritage Ln
- 2558 N Ridge Ave
- 2550 N Ridge Ave
- 2562 N Ridge Ave
- 2546 N Ridge Ave
- 2551 N Ridge Ave
- 2555 N Ridge Ave
- 2547 N Ridge Ave
- 2566 N Ridge Ave
- 2559 N Ridge Ave
- 2543 N Ridge Ave
- 2563 N Ridge Ave
- 2570 N Ridge Ave
- 2535 N Ridge Ave
- 2100 N Ridge Ave
- 2538 N Ridge Ave
- 2524 N Walnut Ave Unit 6
- 2526 N Walnut Ave
- 2522 N Walnut Ave
- 2567 N Ridge Ave
- 2528 N Walnut Ave