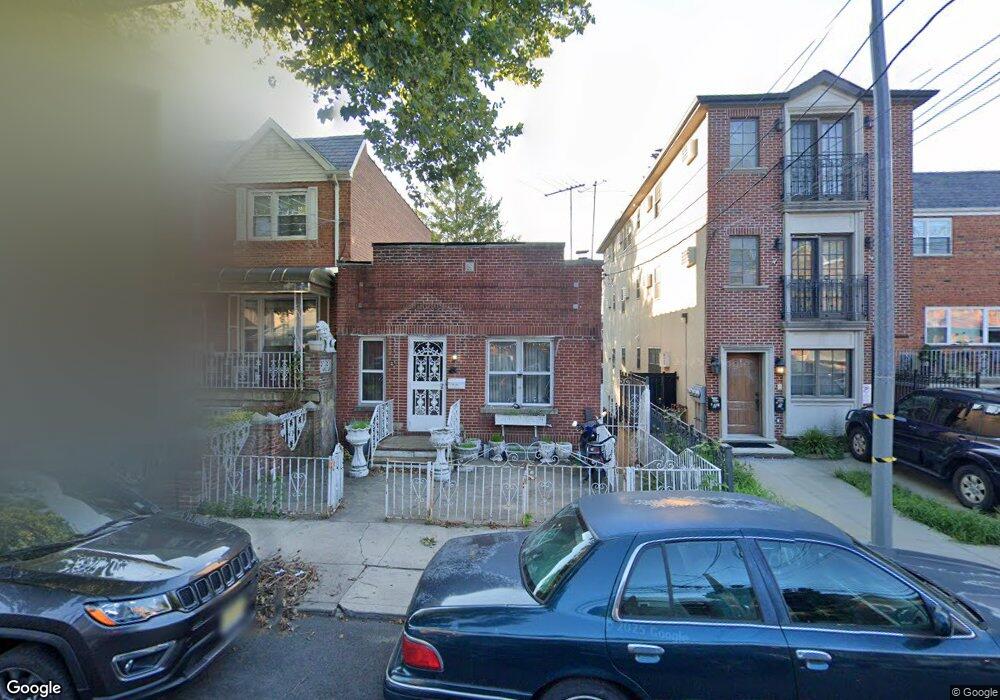
2555 48th St Astoria, NY 11103
Astoria NeighborhoodEstimated Value: $974,000 - $1,087,000
4
Beds
2
Baths
1,368
Sq Ft
$753/Sq Ft
Est. Value
About This Home
This home is located at 2555 48th St, Astoria, NY 11103 and is currently estimated at $1,029,925, approximately $752 per square foot. 2555 48th St is a home located in Queens County with nearby schools including P.S. 151 - Mary D. Carter, I.S. 010 Horace Greeley, and William Cullen Bryant High School.
Ownership History
Date
Name
Owned For
Owner Type
Purchase Details
Closed on
Jun 3, 2022
Sold by
Antzoulatos Alex
Bought by
Mattina Giuseppe
Current Estimated Value
Purchase Details
Closed on
Oct 2, 2018
Sold by
Mattina Giuseppe
Bought by
Antzoulatos Alex
Purchase Details
Closed on
Dec 15, 2011
Sold by
Lalicata Lina and Lalicata Mario
Bought by
Mattina Giuseppe
Purchase Details
Closed on
Dec 13, 2011
Sold by
Lalicata Mario
Bought by
Mattina Giuseppe
Purchase Details
Closed on
Oct 21, 2011
Sold by
Lalicata Lina and Lalicata Mario
Bought by
Lalicata Lina and Lalicata Mario
Create a Home Valuation Report for This Property
The Home Valuation Report is an in-depth analysis detailing your home's value as well as a comparison with similar homes in the area
Home Values in the Area
Average Home Value in this Area
Purchase History
| Date | Buyer | Sale Price | Title Company |
|---|---|---|---|
| Mattina Giuseppe | -- | -- | |
| Antzoulatos Alex | -- | -- | |
| Mattina Giuseppe | -- | -- | |
| Mattina Giuseppe | -- | -- | |
| Lalicata Lina | -- | -- |
Source: Public Records
Tax History Compared to Growth
Tax History
| Year | Tax Paid | Tax Assessment Tax Assessment Total Assessment is a certain percentage of the fair market value that is determined by local assessors to be the total taxable value of land and additions on the property. | Land | Improvement |
|---|---|---|---|---|
| 2025 | $5,267 | $27,769 | $5,146 | $22,623 |
| 2024 | $5,267 | $26,225 | $5,031 | $21,194 |
| 2023 | $5,064 | $24,936 | $5,260 | $19,676 |
| 2022 | $4,720 | $63,360 | $12,720 | $50,640 |
| 2021 | $4,976 | $67,740 | $12,720 | $55,020 |
| 2020 | $4,898 | $58,260 | $12,720 | $45,540 |
| 2019 | $4,572 | $55,980 | $12,720 | $43,260 |
| 2018 | $4,236 | $20,780 | $6,705 | $14,075 |
| 2017 | $4,017 | $19,704 | $5,993 | $13,711 |
| 2016 | $3,939 | $19,704 | $5,993 | $13,711 |
| 2015 | $2,022 | $19,284 | $6,764 | $12,520 |
| 2014 | $2,022 | $18,212 | $7,482 | $10,730 |
Source: Public Records
Map
Nearby Homes