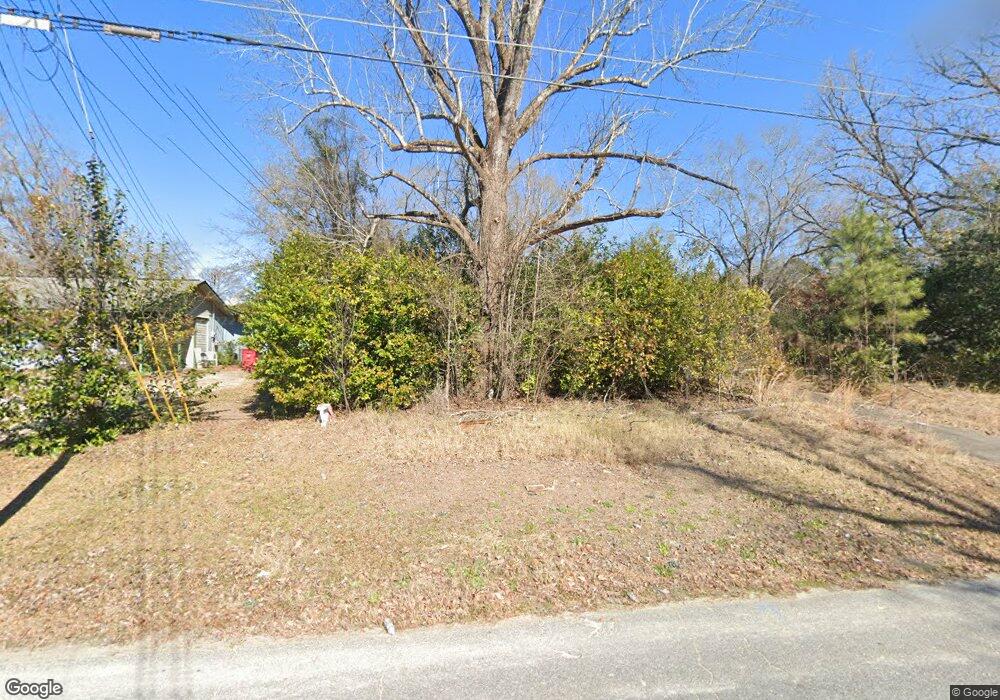
2555 Greenleaf Dr Macon, GA 31206
Estimated Value: $90,000 - $117,000
4
Beds
2
Baths
876
Sq Ft
$117/Sq Ft
Est. Value
About This Home
This home is located at 2555 Greenleaf Dr, Macon, GA 31206 and is currently estimated at $102,590, approximately $117 per square foot. 2555 Greenleaf Dr is a home located in Bibb County with nearby schools including Southfield Elementary School, Southwest High School, and Gilead Christian Academy.
Ownership History
Date
Name
Owned For
Owner Type
Purchase Details
Closed on
Jul 29, 2024
Sold by
Macon-Bibb County Land Bank
Bought by
Buy Up The Bloc Llc
Current Estimated Value
Purchase Details
Closed on
Apr 5, 2024
Sold by
Bibb County
Bought by
Macon-Bibb Cnty Land Bk Author
Purchase Details
Closed on
Oct 31, 2005
Sold by
Early Nicole D
Bought by
Clark Adam
Purchase Details
Closed on
Oct 28, 2005
Sold by
Childers Jonathan K and Childers Jennifer
Bought by
Early Nicole D
Purchase Details
Closed on
Dec 5, 1997
Create a Home Valuation Report for This Property
The Home Valuation Report is an in-depth analysis detailing your home's value as well as a comparison with similar homes in the area
Purchase History
| Date | Buyer | Sale Price | Title Company |
|---|---|---|---|
| Buy Up The Bloc Llc | $10,000 | None Listed On Document | |
| Macon-Bibb Cnty Land Bk Author | $6,954 | None Listed On Document | |
| Clark Adam | -- | None Available | |
| Early Nicole D | $55,000 | None Available | |
| -- | $53,000 | -- |
Source: Public Records
Tax History
| Year | Tax Paid | Tax Assessment Tax Assessment Total Assessment is a certain percentage of the fair market value that is determined by local assessors to be the total taxable value of land and additions on the property. | Land | Improvement |
|---|---|---|---|---|
| 2025 | $71 | $2,900 | $2,900 | $0 |
| 2024 | $74 | $2,900 | $2,900 | $0 |
| 2023 | $34 | $1,160 | $1,160 | $0 |
| 2022 | $600 | $4,221 | $3,536 | $685 |
| 2021 | $480 | $3,051 | $2,475 | $576 |
| 2020 | $80 | $2,073 | $1,768 | $305 |
| 2019 | $118 | $3,004 | $1,768 | $1,236 |
| 2018 | $490 | $5,178 | $1,768 | $3,410 |
| 2017 | $194 | $5,178 | $1,768 | $3,410 |
| 2016 | $455 | $13,160 | $1,768 | $11,392 |
| 2015 | $644 | $13,160 | $1,768 | $11,392 |
| 2014 | $878 | $17,905 | $1,768 | $16,137 |
Source: Public Records
Map
Nearby Homes
- 2561 Greenleaf Dr
- 2559 Burbank Place
- 4370 Ashland Dr
- 4524 Dorset Dr
- 2611 Village Green Ln
- 4340 Thrasher Cir
- 4416 Elkan Ave
- 4496 Thrasher Cir
- 5971 Bloomfield Rd
- 2689 Village Green Ln
- 5756 Satterfield Dr
- 2465 Thrasher Ave
- 2452 Thrasher Ave
- 2468 Brevard Dr
- 4685 Pinedale Dr
- 4249 Elkan Ave
- 2431 Rosen Ave
- 2403 N Groveland Cir
- 2732 Village Green Ln
- 2422 Adger Rd
- 4453 Ashland Dr
- 4439 Ashland Dr
- 4425 Ashland Dr
- 4390 Thrasher Cir
- 2569 Greenleaf Dr
- 2558 Greenleaf Dr
- 2552 Greenleaf Dr
- 4394 Thrasher Cir
- 2564 Greenleaf Dr
- 4417 Ashland Dr
- 2546 Greenleaf Dr
- 4386 Thrasher Cir
- 2570 Greenleaf Dr
- 2540 Greenleaf Dr
- 4446 Ashland Dr
- 4398 Thrasher Cir
- 4438 Ashland Dr
- 4424 Ashland Dr
- 2532 Greenleaf Dr
- 4409 Ashland Dr
Your Personal Tour Guide
Ask me questions while you tour the home.