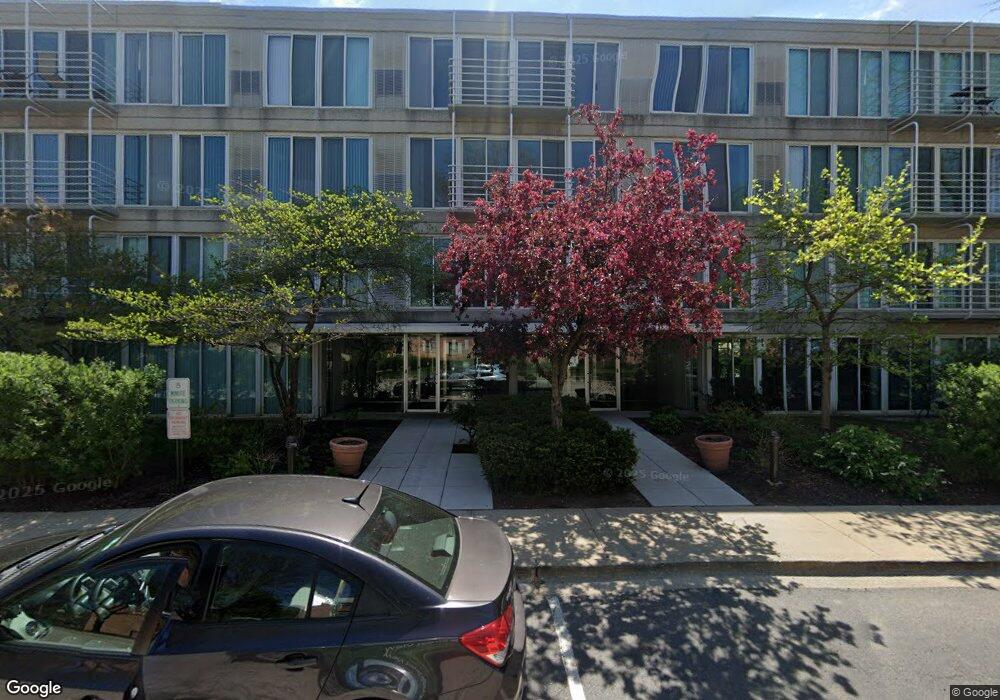
2555 Gross Point Rd Unit 301 Evanston, IL 60201
Central Street NeighborhoodEstimated Value: $211,000 - $296,000
1
Bed
1
Bath
750
Sq Ft
$331/Sq Ft
Est. Value
About This Home
This home is located at 2555 Gross Point Rd Unit 301, Evanston, IL 60201 and is currently estimated at $248,621, approximately $331 per square foot. 2555 Gross Point Rd Unit 301 is a home located in Cook County with nearby schools including Willard Elementary School, Haven Middle School, and Evanston Township High School.
Ownership History
Date
Name
Owned For
Owner Type
Purchase Details
Closed on
Aug 11, 2015
Sold by
Cullen Wagner Teresa
Bought by
Heidt Daniel Arthur
Current Estimated Value
Home Financials for this Owner
Home Financials are based on the most recent Mortgage that was taken out on this home.
Original Mortgage
$123,000
Outstanding Balance
$97,842
Interest Rate
4.37%
Mortgage Type
New Conventional
Estimated Equity
$150,779
Purchase Details
Closed on
Sep 30, 2011
Sold by
Bagby Joseph C
Bought by
Cullen Wagner Teresa
Purchase Details
Closed on
Jan 24, 1996
Sold by
Bagby James W
Bought by
Bagby Joseph C
Purchase Details
Closed on
Nov 30, 1995
Sold by
Betty Bruce William and Veeder Karen L
Bought by
Bagby James W
Create a Home Valuation Report for This Property
The Home Valuation Report is an in-depth analysis detailing your home's value as well as a comparison with similar homes in the area
Home Values in the Area
Average Home Value in this Area
Purchase History
| Date | Buyer | Sale Price | Title Company |
|---|---|---|---|
| Heidt Daniel Arthur | $164,000 | Ct | |
| Cullen Wagner Teresa | $106,500 | Cambridge Title Company | |
| Bagby Joseph C | -- | -- | |
| Bagby James W | $122,500 | Attorneys Natl Title Network |
Source: Public Records
Mortgage History
| Date | Status | Borrower | Loan Amount |
|---|---|---|---|
| Open | Heidt Daniel Arthur | $123,000 |
Source: Public Records
Tax History Compared to Growth
Tax History
| Year | Tax Paid | Tax Assessment Tax Assessment Total Assessment is a certain percentage of the fair market value that is determined by local assessors to be the total taxable value of land and additions on the property. | Land | Improvement |
|---|---|---|---|---|
| 2024 | $3,465 | $17,630 | $1,673 | $15,957 |
| 2023 | $3,301 | $17,630 | $1,673 | $15,957 |
| 2022 | $3,301 | $17,630 | $1,673 | $15,957 |
| 2021 | $2,988 | $14,591 | $1,115 | $13,476 |
| 2020 | $3,008 | $14,591 | $1,115 | $13,476 |
| 2019 | $2,943 | $15,992 | $1,115 | $14,877 |
| 2018 | $2,492 | $12,530 | $912 | $11,618 |
| 2017 | $2,562 | $12,530 | $912 | $11,618 |
| 2016 | $2,663 | $12,530 | $912 | $11,618 |
| 2015 | $2,248 | $10,605 | $760 | $9,845 |
| 2014 | $2,239 | $10,605 | $760 | $9,845 |
| 2013 | $2,916 | $10,605 | $760 | $9,845 |
Source: Public Records
Map
Nearby Homes
- 2555 Gross Point Rd Unit 112
- 3451 Harrison St
- 2501 Crawford Ave
- 3233 Central St
- 2424 Cowper Ave
- 2518 Ridgeway Ave
- 2663 Lawndale Ave
- 9628 Keystone Ave
- 2047 Wilmette Ave
- 2536 Old Glenview Rd
- 2951 Colfax St
- 1918 Wilmette Ave Unit B
- 10015 Beverly Dr Unit 105
- 115 16th St
- 2221 Lincolnwood Dr
- 10124 Peach Pkwy Unit N208
- 4710 Russett Ln Unit R1
- 2239 Washington Ave
- 1517 Gregory Ave
- 408 Beverly Dr
- 2555 Gross Point Rd Unit 110
- 2555 Gross Point Rd Unit 406
- 2555 Gross Point Rd Unit 407
- 2555 Gross Point Rd Unit 410
- 2555 Gross Point Rd Unit 205
- 2555 Gross Point Rd Unit 400
- 2555 Gross Point Rd Unit 411
- 2555 Gross Point Rd Unit 202
- 2555 Gross Point Rd Unit 308
- 2555 Gross Point Rd Unit 412
- 2555 Gross Point Rd Unit 105
- 2555 Gross Point Rd Unit 404
- 2555 Gross Point Rd Unit 403
- 2555 Gross Point Rd Unit 307
- 2555 Gross Point Rd Unit 306
- 2555 Gross Point Rd Unit 305
- 2555 Gross Point Rd Unit 212
- 2555 Gross Point Rd Unit 203
- 2555 Gross Point Rd Unit 201
- 2555 Gross Point Rd Unit 109