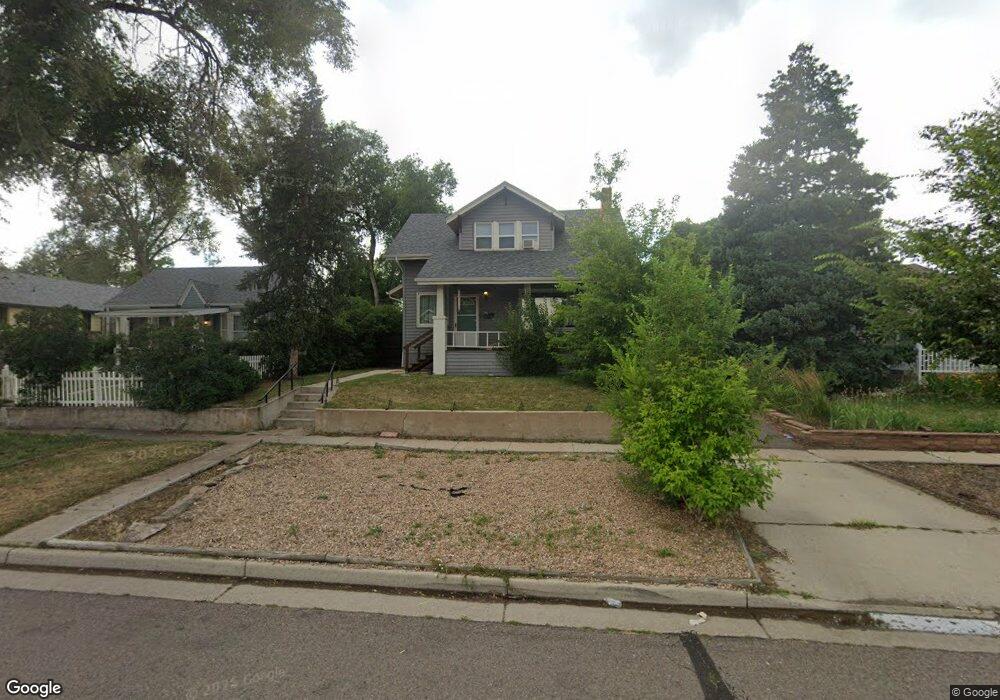
2555 Harlan St Edgewater, CO 80214
Estimated Value: $521,513 - $610,000
3
Beds
1
Bath
1,200
Sq Ft
$462/Sq Ft
Est. Value
About This Home
This home is located at 2555 Harlan St, Edgewater, CO 80214 and is currently estimated at $554,628, approximately $462 per square foot. 2555 Harlan St is a home located in Jefferson County with nearby schools including Edgewater Elementary School, Jefferson High School, and Beth Eden Baptist School.
Ownership History
Date
Name
Owned For
Owner Type
Purchase Details
Closed on
Oct 29, 2013
Sold by
Facinelli Terri L
Bought by
Seifert Teniel
Current Estimated Value
Home Financials for this Owner
Home Financials are based on the most recent Mortgage that was taken out on this home.
Original Mortgage
$167,200
Outstanding Balance
$126,303
Interest Rate
4.56%
Mortgage Type
New Conventional
Estimated Equity
$428,325
Purchase Details
Closed on
Nov 20, 2000
Sold by
Facinelli Terri L Facinelli Dorthy E
Bought by
Facinelli Dorothy E
Home Financials for this Owner
Home Financials are based on the most recent Mortgage that was taken out on this home.
Original Mortgage
$81,250
Interest Rate
7.84%
Mortgage Type
Stand Alone First
Purchase Details
Closed on
Oct 7, 1998
Sold by
Facinelli Dorthy E
Bought by
Facinelli Terri L and Facinelli Dorthy E
Create a Home Valuation Report for This Property
The Home Valuation Report is an in-depth analysis detailing your home's value as well as a comparison with similar homes in the area
Home Values in the Area
Average Home Value in this Area
Purchase History
| Date | Buyer | Sale Price | Title Company |
|---|---|---|---|
| Seifert Teniel | $209,000 | Homestead Title & Escrow | |
| Facinelli Dorothy E | -- | -- | |
| Facinelli Terri L | -- | -- |
Source: Public Records
Mortgage History
| Date | Status | Borrower | Loan Amount |
|---|---|---|---|
| Open | Seifert Teniel | $167,200 | |
| Previous Owner | Facinelli Dorothy E | $81,250 |
Source: Public Records
Tax History Compared to Growth
Tax History
| Year | Tax Paid | Tax Assessment Tax Assessment Total Assessment is a certain percentage of the fair market value that is determined by local assessors to be the total taxable value of land and additions on the property. | Land | Improvement |
|---|---|---|---|---|
| 2024 | $2,852 | $33,431 | $16,756 | $16,675 |
| 2023 | $2,852 | $33,431 | $16,756 | $16,675 |
| 2022 | $2,317 | $26,673 | $14,464 | $12,209 |
| 2021 | $2,348 | $27,440 | $14,880 | $12,560 |
| 2020 | $2,127 | $24,990 | $14,379 | $10,611 |
| 2019 | $2,098 | $24,990 | $14,379 | $10,611 |
| 2018 | $2,021 | $23,263 | $11,654 | $11,609 |
| 2017 | $1,820 | $23,263 | $11,654 | $11,609 |
| 2016 | $1,578 | $18,859 | $5,645 | $13,214 |
| 2015 | $1,304 | $18,859 | $5,645 | $13,214 |
| 2014 | $1,304 | $14,607 | $4,872 | $9,735 |
Source: Public Records
Map
Nearby Homes
- 2598 Harlan St Unit 1
- 2570 Jay St
- 2685 Gray St
- 2568 Eaton St
- 2890 N Harlan St Unit 102
- 2577 Depew St
- 2777 Kendall St
- 2845 Fenton St
- 6000 W 29th Ave
- 2243 N Harlan St
- 2461 Depew St
- 6505 W 25th Ln
- 2455 Chase St
- 2403 Chase St
- 2403 Chase St Unit 25
- 2915 Depew St
- 2902 Depew St
- 2030 Fenton St
- 2946 Fenton St
- 3022 Fenton St
- 2551 Harlan St
- 2563 Harlan St
- 2569 Harlan St
- 2570 Ingalls St
- 2560 Ingalls St
- 2574 Ingalls St
- 2575 Harlan St
- 2575 N Harlan St
- 2554 Ingalls St
- 2535 Harlan St
- 2578 Ingalls St
- 2550 Ingalls St
- 2582 Ingalls St
- 2529 Harlan St
- 2544 Ingalls St
- 2570 Harlan St
- 2550 Harlan St
- 2590 Harlan St
- 2540 Harlan St
- 2594 Harlan St