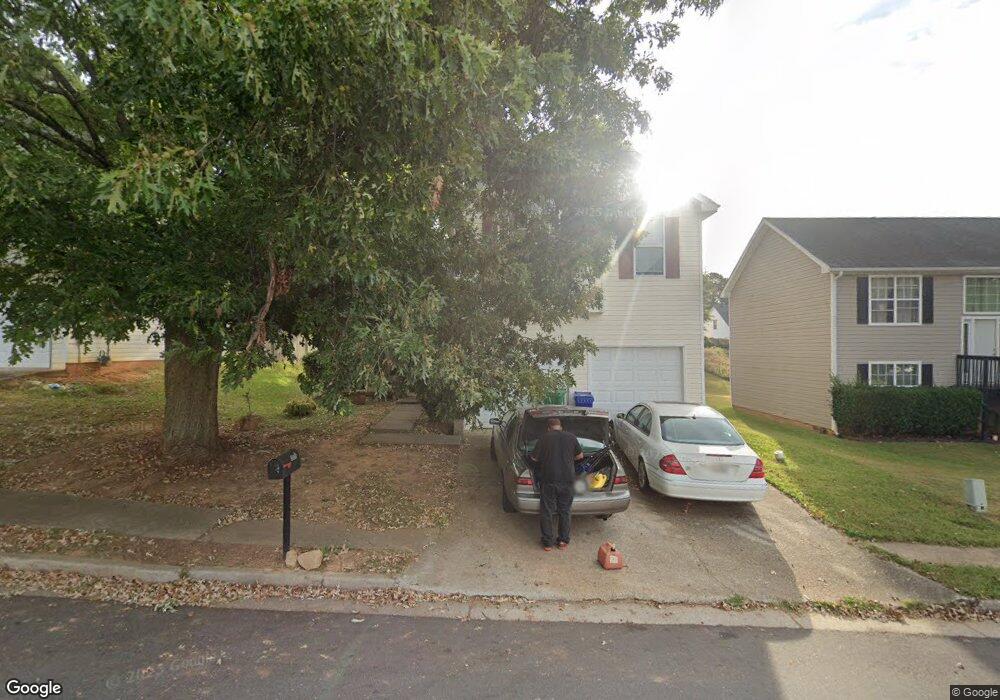
2555 Rambling Way Lithonia, GA 30058
Estimated Value: $234,000 - $252,000
3
Beds
3
Baths
1,684
Sq Ft
$143/Sq Ft
Est. Value
About This Home
This home is located at 2555 Rambling Way, Lithonia, GA 30058 and is currently estimated at $240,168, approximately $142 per square foot. 2555 Rambling Way is a home located in DeKalb County with nearby schools including Stoneview Elementary School, Lithonia Middle School, and Lithonia High School.
Ownership History
Date
Name
Owned For
Owner Type
Purchase Details
Closed on
Apr 9, 2025
Sold by
Home Sfr Borrower Llc
Bought by
Fyr Sfr Borrower Llc
Current Estimated Value
Purchase Details
Closed on
Feb 3, 2014
Sold by
Vandang Tan Van
Bought by
Rpa4 Llc
Purchase Details
Closed on
Mar 6, 2009
Sold by
Jjs Capital Partners Llc
Bought by
Vandang Tan
Home Financials for this Owner
Home Financials are based on the most recent Mortgage that was taken out on this home.
Original Mortgage
$40,500
Interest Rate
5.29%
Mortgage Type
New Conventional
Purchase Details
Closed on
Mar 4, 2008
Sold by
Wells Fargo Bank Na
Bought by
Hud-Housing Of Urban Dev
Purchase Details
Closed on
Mar 20, 2001
Sold by
Global Residential Inc
Bought by
Redd Mary D
Home Financials for this Owner
Home Financials are based on the most recent Mortgage that was taken out on this home.
Original Mortgage
$118,750
Interest Rate
7.02%
Mortgage Type
FHA
Create a Home Valuation Report for This Property
The Home Valuation Report is an in-depth analysis detailing your home's value as well as a comparison with similar homes in the area
Home Values in the Area
Average Home Value in this Area
Purchase History
| Date | Buyer | Sale Price | Title Company |
|---|---|---|---|
| Fyr Sfr Borrower Llc | -- | -- | |
| Rpa4 Llc | $65,000 | -- | |
| Vandang Tan | $54,000 | -- | |
| Jjs Capital Partners Llc | -- | -- | |
| Hud-Housing Of Urban Dev | -- | -- | |
| Wells Fargo Bank Na | $118,050 | -- | |
| Redd Mary D | $119,800 | -- |
Source: Public Records
Mortgage History
| Date | Status | Borrower | Loan Amount |
|---|---|---|---|
| Previous Owner | Jjs Capital Partners Llc | $40,500 | |
| Previous Owner | Redd Mary D | $118,750 |
Source: Public Records
Tax History Compared to Growth
Tax History
| Year | Tax Paid | Tax Assessment Tax Assessment Total Assessment is a certain percentage of the fair market value that is determined by local assessors to be the total taxable value of land and additions on the property. | Land | Improvement |
|---|---|---|---|---|
| 2025 | $4,873 | $99,520 | $18,000 | $81,520 |
| 2024 | $4,770 | $97,920 | $18,000 | $79,920 |
| 2023 | $4,770 | $90,480 | $18,000 | $72,480 |
| 2022 | $3,704 | $77,160 | $8,000 | $69,160 |
| 2021 | $2,945 | $58,960 | $8,000 | $50,960 |
| 2020 | $2,128 | $41,080 | $8,000 | $33,080 |
| 2019 | $2,116 | $41,080 | $8,000 | $33,080 |
| 2018 | $1,857 | $44,800 | $8,000 | $36,800 |
| 2017 | $1,459 | $26,000 | $4,200 | $21,800 |
| 2016 | $1,462 | $26,000 | $4,200 | $21,800 |
| 2014 | $1,590 | $28,200 | $4,200 | $24,000 |
Source: Public Records
Map
Nearby Homes
- 2520 Rambling Way
- 6304 Kendra Ln
- 6460 Wellington Chase Ct
- 6457 Wellington Chase Ct
- 6410 Kennonbriar Ct
- 6384 Stonebridge Creek Ln
- 6518 Wellington Chase Ct
- 6396 Kennonbriar Ct
- 6394 Kennonbriar Ct
- 6372 Stonebridge Creek Ln
- 6542 Wellington Chase Ct
- 2390 Camden Oak Way
- 3034 Stonebridge Creek Dr
- 6630 Pole Creek Dr
- 6550 Wellington Chase Ct Unit 6550
- 6342 Kinsland Ct
- 6565 Shaffers Way
- 2561 Rambling Way
- 2549 Rambling Way Unit 2
- 3111 Stonebridge Creek Dr Unit 2
- 3117 Stonebridge Creek Dr Unit 2
- 2567 Rambling Way Unit 2
- 2556 Rambling Way
- 3121 Stonebridge Creek Dr
- 3105 Stonebridge Creek Dr Unit 2
- 2562 Rambling Way
- 2573 Rambling Way
- 3125 Stonebridge Creek Dr Unit 2
- 6642 Shaffers Way
- 3099 Stonebridge Creek Dr
- 2544 Rambling Way
- 2579 Rambling Way Unit 2
- 3093 Stonebridge Creek Dr
- 6286 Kendra Ln Unit 2
- 6638 Shaffers Way Unit 1
- 6637 Shaffers Way Unit 1
- 6511 Brenda Ann Dr Unit 1