Estimated Value: $305,000 - $344,000
5
Beds
4
Baths
4,216
Sq Ft
$77/Sq Ft
Est. Value
About This Home
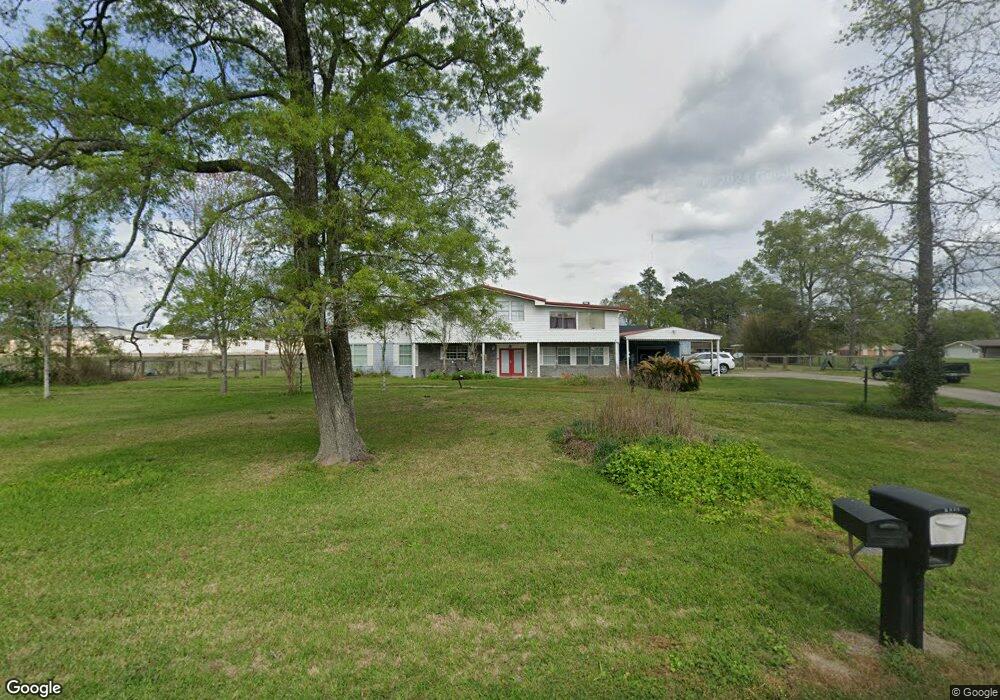
This home is located at 2555 Roosevelt St, Vidor, TX 77662 and is currently estimated at $325,196, approximately $77 per square foot. 2555 Roosevelt St is a home located in Orange County with nearby schools including Faith Christian Academy.
Ownership History
Date
Name
Owned For
Owner Type
Purchase Details
Closed on
Apr 6, 2017
Sold by
Dean Adam C and Dean Samantha L
Bought by
Mccauley Thomas and Mccauley Pamela
Current Estimated Value
Home Financials for this Owner
Home Financials are based on the most recent Mortgage that was taken out on this home.
Original Mortgage
$199,900
Outstanding Balance
$165,044
Interest Rate
4.1%
Mortgage Type
VA
Estimated Equity
$160,152
Purchase Details
Closed on
Jun 26, 2014
Sold by
Shafer Uina
Bought by
Mccauley Thomas and Mccauley Pamela
Home Financials for this Owner
Home Financials are based on the most recent Mortgage that was taken out on this home.
Original Mortgage
$185,913
Interest Rate
4.23%
Mortgage Type
VA
Purchase Details
Closed on
Jun 24, 2014
Sold by
Shafer Uina
Bought by
Dean Adam C and Dean Samantha L
Home Financials for this Owner
Home Financials are based on the most recent Mortgage that was taken out on this home.
Original Mortgage
$185,913
Interest Rate
4.23%
Mortgage Type
VA
Create a Home Valuation Report for This Property
The Home Valuation Report is an in-depth analysis detailing your home's value as well as a comparison with similar homes in the area
Home Values in the Area
Average Home Value in this Area
Purchase History
| Date | Buyer | Sale Price | Title Company |
|---|---|---|---|
| Mccauley Thomas | -- | Capital Title Of Texas Llc | |
| Mccauley Thomas | -- | -- | |
| Dean Adam C | -- | Stc |
Source: Public Records
Mortgage History
| Date | Status | Borrower | Loan Amount |
|---|---|---|---|
| Open | Mccauley Thomas | $199,900 | |
| Previous Owner | Dean Adam C | $185,913 |
Source: Public Records
Tax History
| Year | Tax Paid | Tax Assessment Tax Assessment Total Assessment is a certain percentage of the fair market value that is determined by local assessors to be the total taxable value of land and additions on the property. | Land | Improvement |
|---|---|---|---|---|
| 2025 | $8,507 | $368,212 | $43,196 | $325,016 |
| 2024 | $77 | $368,924 | $43,196 | $325,728 |
| 2023 | $7,190 | $297,072 | $14,433 | $282,639 |
| 2022 | $0 | $265,823 | $14,433 | $251,390 |
| 2021 | $7,012 | $234,864 | $14,433 | $230,460 |
| 2020 | $6,485 | $213,513 | $14,433 | $199,080 |
| 2019 | $6,449 | $210,243 | $14,433 | $195,810 |
| 2018 | $6,014 | $200,913 | $14,433 | $186,480 |
| 2017 | $4,928 | $200,913 | $14,433 | $186,480 |
| 2016 | $5,680 | $187,893 | $14,433 | $173,460 |
| 2015 | -- | $176,283 | $14,433 | $161,850 |
| 2014 | -- | $128,902 | $14,433 | $114,469 |
Source: Public Records
Map
Nearby Homes
- 2650 Roosevelt St
- 0 School Rd
- 2725 E Railroad St
- 2950 Old Highway 90 E
- 460 Rosewood St
- 1560 Posey Ln
- 390 Woodlawn St
- 325 Jennings Rd
- 235 Jennings Rd
- tbd Oakland St
- 305 Oakland Dr
- 000 Hwy 1132
- 1025 Strickland St
- 285 Lakewood Dr
- 3118 Flora St
- 605 N Lakeside St
- 3540 Evangeline Dr
- 18185 Ih 10
- 3530 Evangeline Dr
- 425 Lawrence Ln
- 2655 Roosevelt St
- 2630 Lincoln St
- 2620 Lincoln St
- 2600 Roosevelt St
- 2550 Roosevelt St
- 2675 Lincoln St
- 2660 Roosevelt St
- 2575 E Railroad St
- 2555 E Railroad St
- 2625 E Railroad St
- 2645 Lincoln St
- 2655 E Railroad St
- 2535 E Railroad St
- 2680 Lincoln St
- 2525 E Railroad St
- 2665 Lincoln St Unit Closing cost assista
- 295 Freeway Dr
- 195 Freeway Dr
- 2675 E Railroad St
- 2675 Roosevelt St Unit 2 lots
Your Personal Tour Guide
Ask me questions while you tour the home.