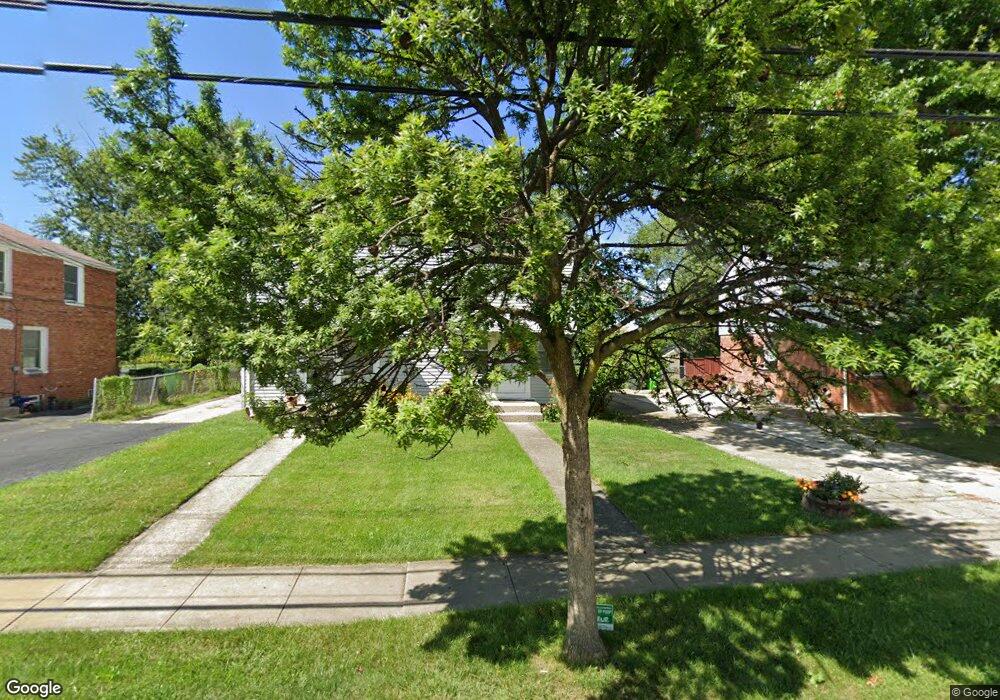
25555 Tungsten Rd Euclid, OH 44132
Estimated Value: $64,708 - $80,000
2
Beds
1
Bath
858
Sq Ft
$85/Sq Ft
Est. Value
About This Home
This home is located at 25555 Tungsten Rd, Euclid, OH 44132 and is currently estimated at $73,177, approximately $85 per square foot. 25555 Tungsten Rd is a home located in Cuyahoga County with nearby schools including Bluestone Elementary School, Euclid High School, and All Saints of St. John Vianney School.
Ownership History
Date
Name
Owned For
Owner Type
Purchase Details
Closed on
Mar 17, 2024
Sold by
M O R Investments Llc and Mor Almog
Bought by
Dbi Investments Llc
Current Estimated Value
Purchase Details
Closed on
Oct 31, 2018
Sold by
Wolanski Michael and Baur Eileen
Bought by
207 Baxster Real Estate Llc
Purchase Details
Closed on
Feb 5, 2018
Sold by
207 Baxster Real Estate Llc
Bought by
Zola Real Estate Llc
Purchase Details
Closed on
Jun 1, 2012
Sold by
Baur Gary and Baur Alma I
Bought by
Baur Eileen
Purchase Details
Closed on
Feb 5, 2008
Sold by
Baur Tim and Baur Eileen
Bought by
Baur Gary
Purchase Details
Closed on
Oct 17, 1986
Sold by
Cadez Phillip J and C A
Bought by
Baur Tim
Purchase Details
Closed on
Jan 1, 1975
Bought by
Cadez Phillip J and C A
Create a Home Valuation Report for This Property
The Home Valuation Report is an in-depth analysis detailing your home's value as well as a comparison with similar homes in the area
Home Values in the Area
Average Home Value in this Area
Purchase History
| Date | Buyer | Sale Price | Title Company |
|---|---|---|---|
| Dbi Investments Llc | $45,000 | Fast Tract Title | |
| 207 Baxster Real Estate Llc | $60,000 | None Available | |
| Zola Real Estate Llc | $34,100 | None Available | |
| Baur Eileen | $10,000 | Attorney | |
| Baur Gary | $26,000 | Executive Title Agency | |
| Baur Tim | $36,500 | -- | |
| Cadez Phillip J | -- | -- |
Source: Public Records
Tax History
| Year | Tax Paid | Tax Assessment Tax Assessment Total Assessment is a certain percentage of the fair market value that is determined by local assessors to be the total taxable value of land and additions on the property. | Land | Improvement |
|---|---|---|---|---|
| 2025 | $1,599 | $22,540 | $3,990 | $18,550 |
| 2024 | $1,647 | $22,540 | $3,990 | $18,550 |
| 2023 | $1,458 | $15,750 | $3,430 | $12,320 |
| 2022 | $1,427 | $15,750 | $3,430 | $12,320 |
| 2021 | $1,580 | $15,750 | $3,430 | $12,320 |
| 2020 | $1,340 | $11,940 | $2,590 | $9,350 |
| 2019 | $1,201 | $34,100 | $7,400 | $26,700 |
| 2018 | $1,207 | $11,940 | $2,590 | $9,350 |
| 2017 | $1,293 | $10,680 | $2,100 | $8,580 |
| 2016 | $1,296 | $10,680 | $2,100 | $8,580 |
| 2015 | $1,378 | $10,680 | $2,100 | $8,580 |
| 2014 | $1,378 | $12,570 | $2,490 | $10,080 |
Source: Public Records
Map
Nearby Homes
- 1471 Hall Ct
- 1437 E 252nd St
- 1530 E 254th St
- 1552 E 254th St
- 25161 Euclid Ave
- 24991 Euclid Ave
- 890 E 250th St
- 942 E 236th St
- 145 Richmond Rd
- 797 Babbitt Rd Unit 15
- 24691 Hawthorne Dr
- 127 Brush Rd
- 22931 Arms Ave
- 25641 Glenbrook Blvd
- 1670 Hillandale Dr
- 1790 Skyline Dr
- 25550 Glenbrook Blvd
- 1807 Skyline Dr
- 24431 Hartland Rd
- 825 E 256th St
- 25551 Tungsten Rd
- 25561 Tungsten Rd
- 25545 Tungsten Rd
- 25565 Tungsten Rd
- 25541 Tungsten Rd
- 25571 Tungsten Rd
- 25535 Tungsten Rd
- 25575 Tungsten Rd
- 25531 Tungsten Rd
- 25554 Tungsten Rd
- 25560 Tungsten Rd
- 25581 Tungsten Rd
- 25564 Tungsten Rd
- 25544 Tungsten Rd
- 25570 Tungsten Rd
- 25525 Tungsten Rd
- 25574 Tungsten Rd
- 25585 Tungsten Rd
- 25534 Tungsten Rd
- 25521 Tungsten Rd
Your Personal Tour Guide
Ask me questions while you tour the home.