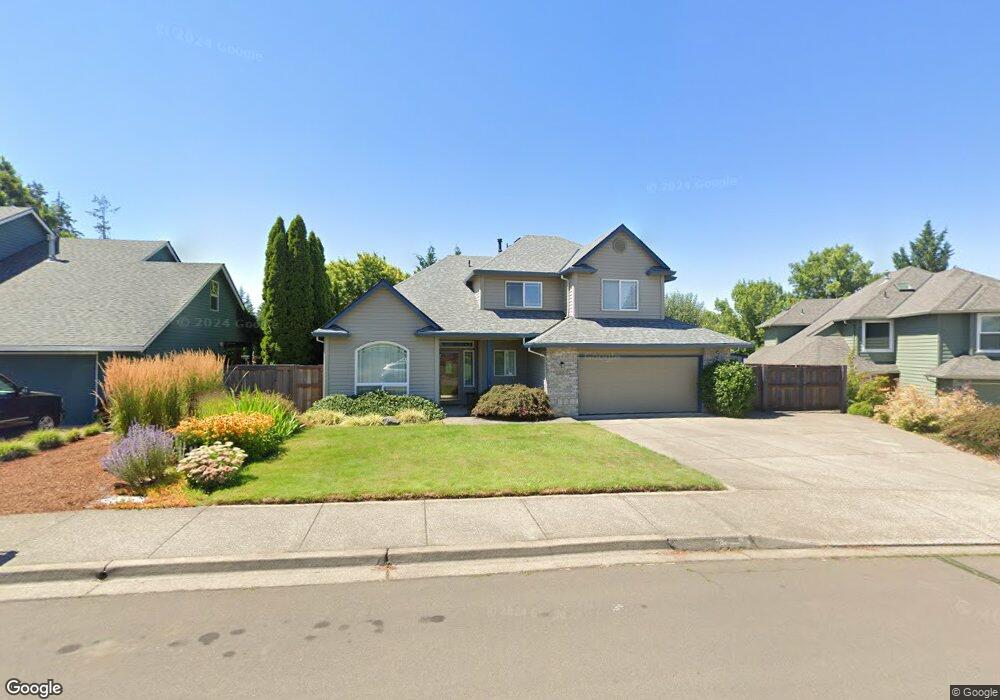
2557 NE Lindsey Dr Hillsboro, OR 97124
Northwest Hillsboro NeighborhoodEstimated Value: $663,200 - $698,000
5
Beds
3
Baths
2,282
Sq Ft
$299/Sq Ft
Est. Value
About This Home
This home is located at 2557 NE Lindsey Dr, Hillsboro, OR 97124 and is currently estimated at $681,300, approximately $298 per square foot. 2557 NE Lindsey Dr is a home located in Washington County with nearby schools including Jackson Elementary School, Evergreen Jr High School, and Glencoe High School.
Ownership History
Date
Name
Owned For
Owner Type
Purchase Details
Closed on
Jul 24, 2015
Sold by
Benson Larry E and Benson Linda S
Bought by
Jonsson Lars E and Kim Jeongnim
Current Estimated Value
Home Financials for this Owner
Home Financials are based on the most recent Mortgage that was taken out on this home.
Original Mortgage
$230,000
Interest Rate
4.01%
Mortgage Type
New Conventional
Purchase Details
Closed on
Jun 5, 2000
Sold by
Hubert Mark P and Vuylsteke Janet A
Bought by
Benson Larry E and Benson Linda S
Home Financials for this Owner
Home Financials are based on the most recent Mortgage that was taken out on this home.
Original Mortgage
$196,200
Interest Rate
8%
Purchase Details
Closed on
May 3, 1999
Sold by
Rose Jeffrey M and Rose Joanne P
Bought by
Hubert Mark P and Vuylsteke Janet A
Home Financials for this Owner
Home Financials are based on the most recent Mortgage that was taken out on this home.
Original Mortgage
$181,600
Interest Rate
6.98%
Create a Home Valuation Report for This Property
The Home Valuation Report is an in-depth analysis detailing your home's value as well as a comparison with similar homes in the area
Home Values in the Area
Average Home Value in this Area
Purchase History
| Date | Buyer | Sale Price | Title Company |
|---|---|---|---|
| Jonsson Lars E | $430,000 | Wfg Title | |
| Benson Larry E | $245,300 | Fidelity National Title Co | |
| Hubert Mark P | $227,000 | First American Title Ins Co |
Source: Public Records
Mortgage History
| Date | Status | Borrower | Loan Amount |
|---|---|---|---|
| Closed | Jonsson Lars E | $230,000 | |
| Previous Owner | Benson Larry E | $196,200 | |
| Previous Owner | Hubert Mark P | $181,600 | |
| Closed | Benson Larry E | $36,700 |
Source: Public Records
Tax History Compared to Growth
Tax History
| Year | Tax Paid | Tax Assessment Tax Assessment Total Assessment is a certain percentage of the fair market value that is determined by local assessors to be the total taxable value of land and additions on the property. | Land | Improvement |
|---|---|---|---|---|
| 2025 | $6,264 | $383,240 | -- | -- |
| 2024 | $6,086 | $372,080 | -- | -- |
| 2023 | $6,086 | $361,250 | $0 | $0 |
| 2022 | $5,921 | $361,250 | $0 | $0 |
| 2021 | $5,802 | $340,520 | $0 | $0 |
| 2020 | $5,677 | $330,610 | $0 | $0 |
| 2019 | $5,514 | $320,990 | $0 | $0 |
| 2018 | $5,278 | $311,650 | $0 | $0 |
| 2017 | $5,087 | $302,580 | $0 | $0 |
| 2016 | $4,947 | $293,770 | $0 | $0 |
| 2015 | $4,748 | $285,220 | $0 | $0 |
| 2014 | $4,721 | $276,920 | $0 | $0 |
Source: Public Records
Map
Nearby Homes
- 2878 NE Aurora Dr
- 2795 NE Lorie Dr
- 2011 NE Josephine Dr
- 2643 NE 2nd Dr
- 3215 NE 4th Ave
- 729 NE Rogahn St
- 175 NE Chancellor Ct
- 3166 NE Glencoe Oaks Place
- 795 NE Rogahn St
- 1900 NE Harewood Place
- 802 NE Brennan Ln
- 2619 NE Charlois Dr
- 2525 NE Charlois Dr
- 773 NE Kathryn St
- 1722 NE Jackson School Rd
- 1425 NE Glen Ellen Dr
- 1670 NE Jackson School Rd
- 1676 NE 2nd Ave
- 886 NE Creeksedge Dr
- 895 NE Addison Ct
- 2535 NE Lindsey Dr
- 2581 NE Lindsey Dr
- 2481 NE Nicki Ct
- 2479 NE Nicki Ct
- 2603 NE Lindsey Dr
- 2511 NE Lindsey Dr
- 2558 NE Lindsey Dr
- 2534 NE Lindsey Dr
- 2467 NE Estate Dr
- 2627 NE Lindsey Dr
- 527 NE Estate Dr
- 2484 NE Nicki Ct
- 525 NE Amanda Place
- 525 NE Amanda Relisted
- 548 NE Amanda Place
- 545 NE Amanda Place
- 551 NE Estate Dr
- 2649 NE Lindsey Dr
- 2494 NE Estate Dr
- 2395 NE Estate Dr