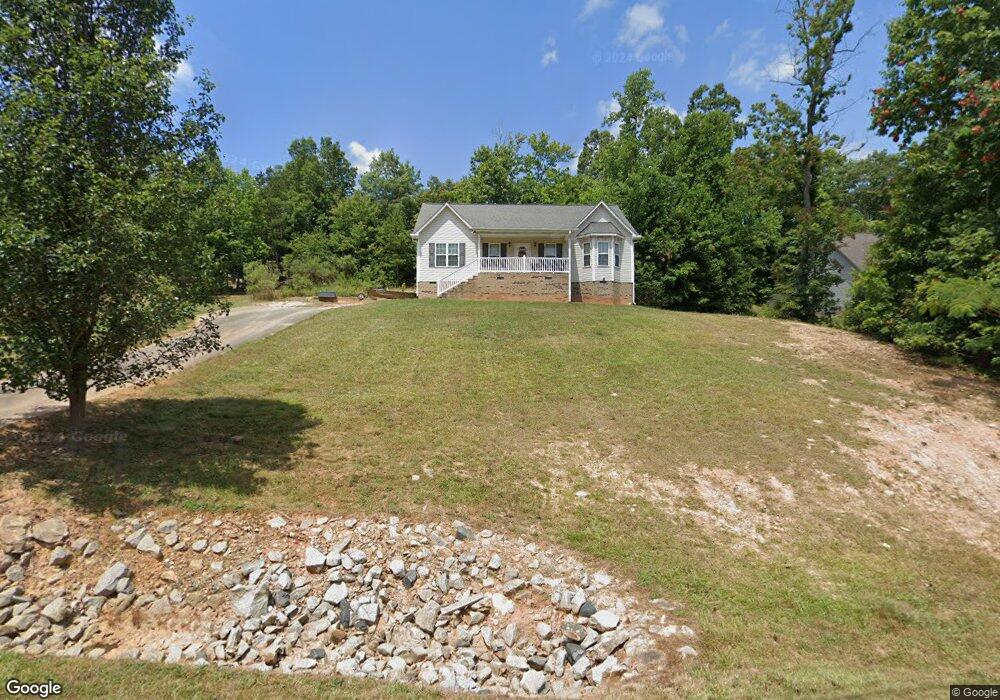
2557 Strawberry Ln Randleman, NC 27317
Estimated Value: $269,010 - $303,000
3
Beds
2
Baths
1,428
Sq Ft
$203/Sq Ft
Est. Value
About This Home
This home is located at 2557 Strawberry Ln, Randleman, NC 27317 and is currently estimated at $289,503, approximately $202 per square foot. 2557 Strawberry Ln is a home located in Randolph County with nearby schools including Randleman Elementary School, Randleman Middle School, and Randleman High School.
Ownership History
Date
Name
Owned For
Owner Type
Purchase Details
Closed on
Jun 4, 2012
Sold by
Shore Matthew R
Bought by
Shore Charity D
Current Estimated Value
Purchase Details
Closed on
Aug 31, 2010
Sold by
Phil Burgess Construction Inc
Bought by
Shore Charity D and Shore Matthew R
Home Financials for this Owner
Home Financials are based on the most recent Mortgage that was taken out on this home.
Original Mortgage
$123,339
Interest Rate
4.59%
Mortgage Type
FHA
Purchase Details
Closed on
May 25, 2006
Sold by
Wow Properties Llc
Bought by
Kennedy Aaron Shane and Kennedy Sherri J
Home Financials for this Owner
Home Financials are based on the most recent Mortgage that was taken out on this home.
Original Mortgage
$80,000
Interest Rate
6.41%
Mortgage Type
Purchase Money Mortgage
Create a Home Valuation Report for This Property
The Home Valuation Report is an in-depth analysis detailing your home's value as well as a comparison with similar homes in the area
Home Values in the Area
Average Home Value in this Area
Purchase History
| Date | Buyer | Sale Price | Title Company |
|---|---|---|---|
| Shore Charity D | -- | None Available | |
| Shore Charity D | $125,000 | None Available | |
| Kennedy Aaron Shane | $94,000 | None Available |
Source: Public Records
Mortgage History
| Date | Status | Borrower | Loan Amount |
|---|---|---|---|
| Previous Owner | Shore Charity D | $123,339 | |
| Previous Owner | Kennedy Aaron Shane | $80,000 |
Source: Public Records
Tax History
| Year | Tax Paid | Tax Assessment Tax Assessment Total Assessment is a certain percentage of the fair market value that is determined by local assessors to be the total taxable value of land and additions on the property. | Land | Improvement |
|---|---|---|---|---|
| 2025 | $2,726 | $224,860 | $45,000 | $179,860 |
| 2024 | $2,721 | $224,860 | $45,000 | $179,860 |
| 2023 | $2,721 | $224,860 | $45,000 | $179,860 |
| 2022 | $1,867 | $143,860 | $25,000 | $118,860 |
| 2021 | $1,867 | $143,860 | $25,000 | $118,860 |
| 2020 | $1,867 | $143,860 | $25,000 | $118,860 |
| 2019 | $1,867 | $143,860 | $25,000 | $118,860 |
| 2018 | $1,545 | $117,230 | $25,000 | $92,230 |
| 2016 | $1,544 | $117,227 | $25,000 | $92,227 |
| 2015 | $1,547 | $117,227 | $25,000 | $92,227 |
| 2014 | $1,506 | $117,227 | $25,000 | $92,227 |
Source: Public Records
Map
Nearby Homes
- 2548 Strawberry Ln
- 2585 Peppertree Ridge Rd
- 0 1st Park Ave
- 2750 Buckhorn Dr
- 00-00 4th Park Ave Unit L20-22
- 00-00 4th Park Ave
- 2411 Whirlwind Ln
- 2339 Hickory Forest Dr
- 2931 Reginas Way
- 2411 Regency Dr
- 2403 Regency Dr
- 2360 Regency Dr
- 2148 Sarina Dr
- 565 Cone Estates St
- 1202 Deerrun Dr
- 2922 Mimosa Ct
- 1240 Old Liberty Rd
- 206 Mcknight St
- 1226 Old Liberty Rd
- 165 Homeplace Dr
- 2563 Strawberry Ln
- 2545 Strawberry Ln
- 2573 Strawberry Ln
- 2539 Strawberry Ln
- 2558 Peppertree Ridge Rd
- 2546 Peppertree Ridge Rd
- 2566 Peppertree Ridge Rd
- 2581 Strawberry Ln
- 750 Raintree Ct
- 2576 Peppertree Ridge Rd
- 2570 Strawberry Ln
- 2538 Strawberry Ln
- 2531 Strawberry Ln
- 2582 Peppertree Ridge Rd
- 763 Raintree Ct
- 2524 Strawberry Ln
- 2532 Peppertree Ridge Rd
- 2532 Strawberry Ln
- 730 Old Castle Dr
- 740 Old Castle Dr
Your Personal Tour Guide
Ask me questions while you tour the home.