Estimated Value: $395,883 - $415,000
3
Beds
2
Baths
1,200
Sq Ft
$340/Sq Ft
Est. Value
About This Home
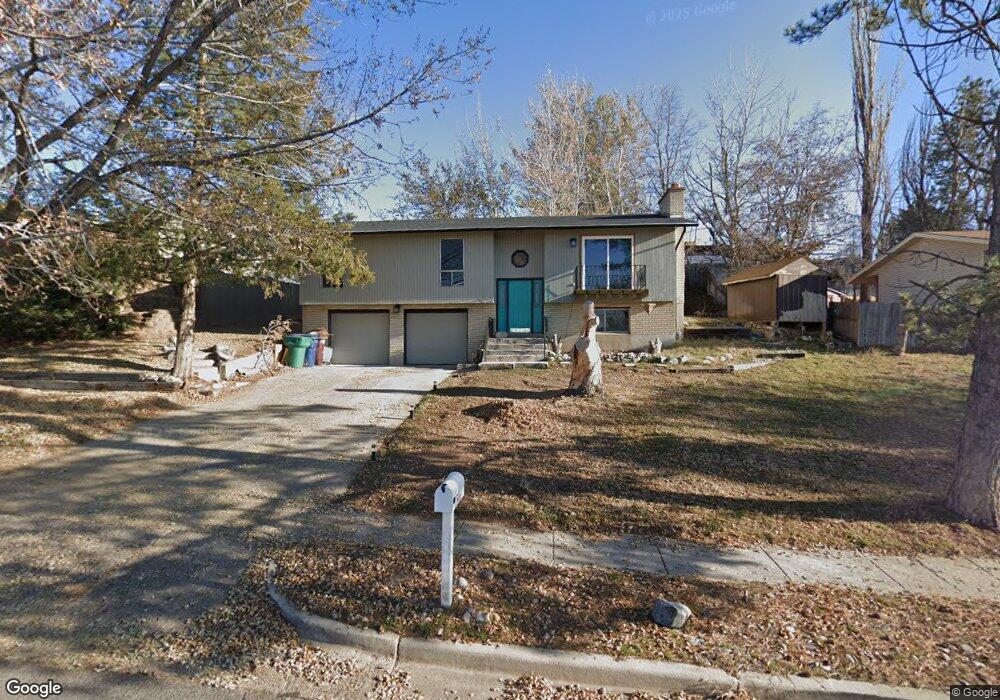
This home is located at 2557 W 4400 S, Roy, UT 84067 and is currently estimated at $407,971, approximately $339 per square foot. 2557 W 4400 S is a home located in Weber County with nearby schools including Valley View School, Sand Ridge Junior High School, and Roy High School.
Ownership History
Date
Name
Owned For
Owner Type
Purchase Details
Closed on
May 12, 2025
Sold by
Mortensen Jeffrey D
Bought by
Jeffrey D Mortensen Family Trust and Mortensen
Current Estimated Value
Purchase Details
Closed on
Mar 6, 2025
Sold by
Mortensen Scott and Mortensen Jeffrey
Bought by
Mortensen Scott A and Mortensen Jeffrey D
Purchase Details
Closed on
Feb 23, 2022
Sold by
Kebede Simon M
Bought by
Mortensen Jeffrey and Mortensen Scott
Purchase Details
Closed on
Sep 15, 2008
Sold by
Florek Darlene M
Bought by
Kebede Simon M and Florek Kebede Darlene
Home Financials for this Owner
Home Financials are based on the most recent Mortgage that was taken out on this home.
Original Mortgage
$127,500
Interest Rate
6.51%
Mortgage Type
Purchase Money Mortgage
Purchase Details
Closed on
Mar 5, 1998
Sold by
Lilly Matthew P
Bought by
Florek Darlene M
Create a Home Valuation Report for This Property
The Home Valuation Report is an in-depth analysis detailing your home's value as well as a comparison with similar homes in the area
Home Values in the Area
Average Home Value in this Area
Purchase History
| Date | Buyer | Sale Price | Title Company |
|---|---|---|---|
| Jeffrey D Mortensen Family Trust | -- | Gt Title | |
| Mortensen Scott A | -- | Gt Title | |
| Mortensen Jeffrey | -- | Gt Title Services | |
| Kebede Simon M | -- | Pinnacle Title | |
| Florek Darlene M | -- | -- |
Source: Public Records
Mortgage History
| Date | Status | Borrower | Loan Amount |
|---|---|---|---|
| Previous Owner | Kebede Simon M | $127,500 |
Source: Public Records
Tax History Compared to Growth
Tax History
| Year | Tax Paid | Tax Assessment Tax Assessment Total Assessment is a certain percentage of the fair market value that is determined by local assessors to be the total taxable value of land and additions on the property. | Land | Improvement |
|---|---|---|---|---|
| 2025 | $2,330 | $364,309 | $105,641 | $258,668 |
| 2024 | $2,274 | $358,000 | $105,641 | $252,359 |
| 2023 | $2,194 | $346,000 | $107,374 | $238,626 |
| 2022 | $2,109 | $187,550 | $53,792 | $133,758 |
| 2021 | $1,786 | $261,000 | $68,071 | $192,929 |
| 2020 | $1,769 | $239,000 | $68,071 | $170,929 |
| 2019 | $1,701 | $216,000 | $38,410 | $177,590 |
| 2018 | $1,670 | $200,000 | $36,512 | $163,488 |
| 2017 | $1,447 | $160,000 | $33,600 | $126,400 |
| 2016 | $1,441 | $86,073 | $18,164 | $67,909 |
| 2015 | $1,290 | $78,175 | $18,164 | $60,011 |
| 2014 | $1,301 | $78,175 | $18,164 | $60,011 |
Source: Public Records
Map
Nearby Homes
- 2642 W 4400 S
- 1952 W 5450 S
- 4670 S 2525 W
- 2802 W 4375 S
- 2263 W 4400 S
- 2816 W 4400 S
- 2259 W 4525 S
- 4118 Westlake Dr
- 4164 S 2400 W
- 2835 W 4200 S
- 2777 W 4175 S Unit 229
- 4328 S 2175 W
- 2778 W 4175 S Unit 235
- 2082 W 4450 S
- 4110 S 2275 W
- 4022 S 2725 W
- 4635 S 2950 W
- 2411 W 4900 S
- 4875 S 2675 W
- 4073 S 2175 W