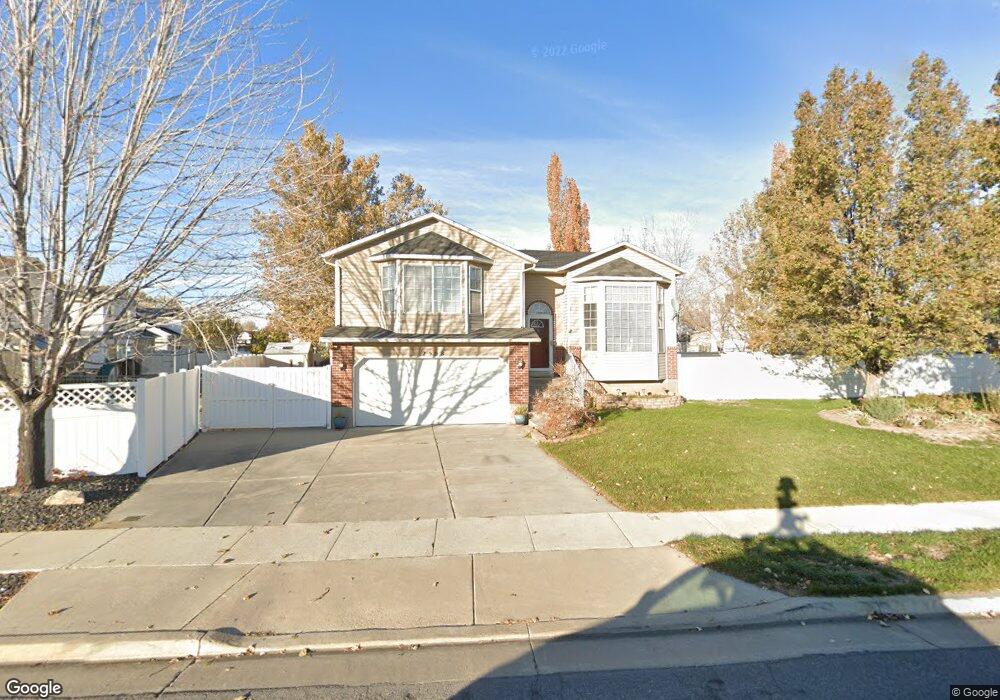
2558 W 1275 N Layton, UT 84041
Estimated Value: $485,000 - $531,000
4
Beds
3
Baths
2,336
Sq Ft
$222/Sq Ft
Est. Value
About This Home
This home is located at 2558 W 1275 N, Layton, UT 84041 and is currently estimated at $517,617, approximately $221 per square foot. 2558 W 1275 N is a home located in Davis County with nearby schools including Ellison Park School, Shoreline Junior High School, and Layton High School.
Ownership History
Date
Name
Owned For
Owner Type
Purchase Details
Closed on
Oct 24, 2019
Sold by
Wheeler George G and Wheeler Darlene D
Bought by
Wheeler George G and Wheeler Darlene D
Current Estimated Value
Purchase Details
Closed on
May 26, 2008
Sold by
Buchanan Bradley P and Buchanan Erin
Bought by
Wheeler George G and Wheeler Darlene D
Purchase Details
Closed on
Nov 19, 2003
Sold by
Oberhansley Eric and Oberhansley Whitney
Bought by
Buchanan Bradley P
Purchase Details
Closed on
Nov 18, 2003
Sold by
Buchanan Bradley P
Bought by
Buchanan Bradley P and Buchanan Erin
Purchase Details
Closed on
Jan 20, 1999
Sold by
Woodside Homes Corp
Bought by
Oberhansley Eric and Oberhansley Whitney
Home Financials for this Owner
Home Financials are based on the most recent Mortgage that was taken out on this home.
Original Mortgage
$125,051
Interest Rate
6.63%
Mortgage Type
FHA
Create a Home Valuation Report for This Property
The Home Valuation Report is an in-depth analysis detailing your home's value as well as a comparison with similar homes in the area
Home Values in the Area
Average Home Value in this Area
Purchase History
| Date | Buyer | Sale Price | Title Company |
|---|---|---|---|
| Wheeler George G | -- | None Available | |
| Wheeler George G | -- | Utah Commercial Title Co | |
| Buchanan Bradley P | -- | First American Title Co | |
| Buchanan Bradley P | -- | First American Title Co | |
| Oberhansley Eric | -- | First American Title Co |
Source: Public Records
Mortgage History
| Date | Status | Borrower | Loan Amount |
|---|---|---|---|
| Previous Owner | Oberhansley Eric | $125,051 |
Source: Public Records
Tax History Compared to Growth
Tax History
| Year | Tax Paid | Tax Assessment Tax Assessment Total Assessment is a certain percentage of the fair market value that is determined by local assessors to be the total taxable value of land and additions on the property. | Land | Improvement |
|---|---|---|---|---|
| 2025 | $2,594 | $272,250 | $121,552 | $150,698 |
| 2024 | $2,455 | $259,600 | $132,167 | $127,433 |
| 2023 | $2,355 | $439,000 | $135,408 | $303,592 |
| 2022 | $2,516 | $254,650 | $81,564 | $173,086 |
| 2021 | $2,219 | $335,000 | $122,349 | $212,651 |
| 2020 | $2,003 | $290,000 | $103,755 | $186,245 |
| 2019 | $1,946 | $276,000 | $104,513 | $171,487 |
| 2018 | $1,868 | $266,000 | $91,880 | $174,120 |
| 2016 | $1,637 | $120,230 | $37,090 | $83,140 |
| 2015 | $1,658 | $115,610 | $37,090 | $78,520 |
| 2014 | $1,658 | $118,188 | $37,090 | $81,098 |
| 2013 | -- | $104,496 | $28,952 | $75,544 |
Source: Public Records
Map
Nearby Homes