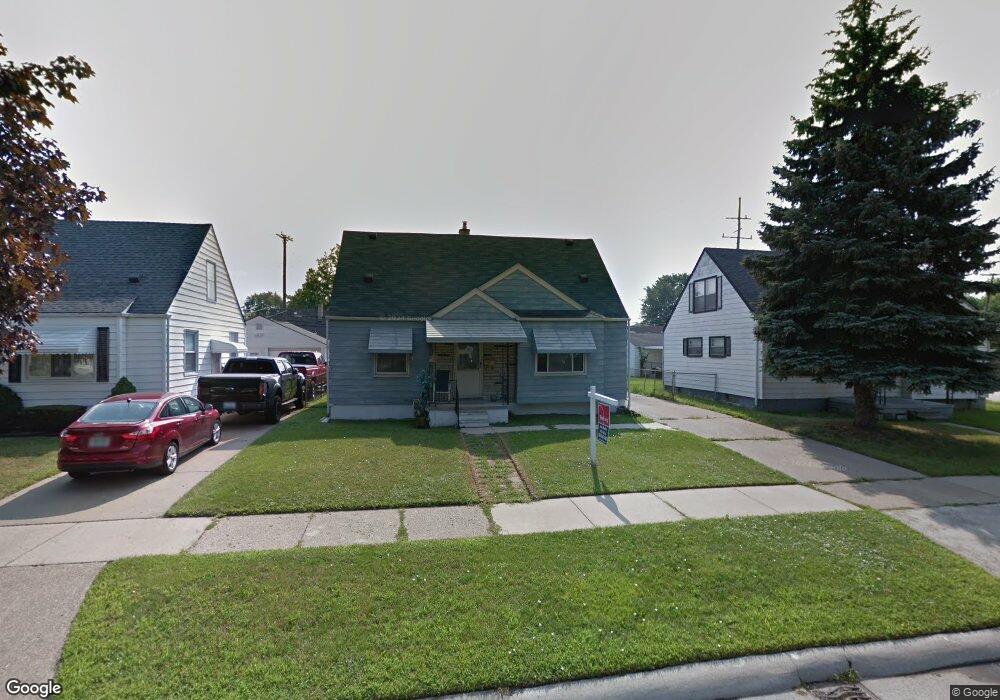
25584 Hayes Rd Unit Bldg-Unit Roseville, MI 48066
Estimated Value: $175,000 - $184,000
3
Beds
1
Bath
1,285
Sq Ft
$140/Sq Ft
Est. Value
About This Home
This home is located at 25584 Hayes Rd Unit Bldg-Unit, Roseville, MI 48066 and is currently estimated at $179,863, approximately $139 per square foot. 25584 Hayes Rd Unit Bldg-Unit is a home located in Macomb County with nearby schools including Dort Elementary School, Joseph G. Steenland Elementary School, and Fountain Elementary School.
Ownership History
Date
Name
Owned For
Owner Type
Purchase Details
Closed on
Nov 19, 2021
Sold by
Stephen Garza
Bought by
Garza Stephen and Garza Jeanie Lou
Current Estimated Value
Home Financials for this Owner
Home Financials are based on the most recent Mortgage that was taken out on this home.
Original Mortgage
$135,744
Interest Rate
3.09%
Mortgage Type
VA
Purchase Details
Closed on
Jan 29, 2021
Sold by
Lazem Suad
Bought by
Garza Stephen
Purchase Details
Closed on
May 30, 2012
Sold by
Fannie Mae
Bought by
Lazem Suad
Purchase Details
Closed on
Sep 7, 2011
Sold by
Bank Of America Na
Bought by
Fannie Mae and Federal National Mortgage Association
Purchase Details
Closed on
Aug 4, 2011
Sold by
Auger Gary and Auger Gina M
Bought by
Bank Of America Na
Purchase Details
Closed on
Mar 18, 1997
Sold by
Arndt W and Arndt K
Bought by
Auger G and Auger G
Create a Home Valuation Report for This Property
The Home Valuation Report is an in-depth analysis detailing your home's value as well as a comparison with similar homes in the area
Home Values in the Area
Average Home Value in this Area
Purchase History
| Date | Buyer | Sale Price | Title Company |
|---|---|---|---|
| Garza Stephen | -- | Bc Law Firm Pa | |
| Garza Stephen | $131,500 | Century Title Agency Svcs | |
| Lazem Suad | $30,000 | Attorneys Title Agency Llc | |
| Fannie Mae | -- | None Available | |
| Bank Of America Na | $90,889 | None Available | |
| Auger G | $84,100 | -- |
Source: Public Records
Mortgage History
| Date | Status | Borrower | Loan Amount |
|---|---|---|---|
| Previous Owner | Garza Stephen | $135,744 |
Source: Public Records
Tax History Compared to Growth
Tax History
| Year | Tax Paid | Tax Assessment Tax Assessment Total Assessment is a certain percentage of the fair market value that is determined by local assessors to be the total taxable value of land and additions on the property. | Land | Improvement |
|---|---|---|---|---|
| 2025 | $3,517 | $76,900 | $0 | $0 |
| 2024 | $1,866 | $72,600 | $0 | $0 |
| 2023 | $1,790 | $65,400 | $0 | $0 |
| 2022 | $3,141 | $53,900 | $0 | $0 |
| 2021 | $1,727 | $47,900 | $0 | $0 |
| 2020 | $1,251 | $43,100 | $0 | $0 |
| 2019 | $1,379 | $37,600 | $0 | $0 |
| 2018 | $1,994 | $0 | $0 | $0 |
| 2017 | $1,884 | $31,094 | $5,345 | $25,749 |
| 2016 | $1,379 | $31,094 | $0 | $0 |
| 2015 | $913 | $27,024 | $0 | $0 |
| 2013 | -- | $27,293 | $0 | $0 |
| 2011 | -- | $36,218 | $0 | $0 |
Source: Public Records
Map
Nearby Homes
- 25297 Fortuna St
- 25207 Fortuna St
- 25280 Dale St
- 25221 Tecla Ave
- 25173 Rosenbusch Blvd
- 25184 Tecla Ave
- 25239 Lehner St
- 26070 Bryan St
- 25135 Dale St
- 25951 Lehner Ct
- 25841 Wiseman St
- 25672 Wiseman St
- 14930 E 10 Mile Rd
- 25940 Lira Ln Unit 1
- 25294 Wiseman St
- 25403 Fern St
- 26260 Bryan St
- 25323 Fern St
- 25754 Santina Ln Unit 18
- 14919 Shirley Ave
- 25584 Hayes Rd
- 25594 Hayes Rd
- 25574 Hayes Rd Unit Bldg-Unit
- 25574 Hayes Rd
- 25602 Hayes Rd
- 25585 Fortuna St
- 25595 Fortuna St
- 25575 Fortuna St
- 25612 Hayes Rd
- 25500 Hayes Rd
- 25613 Fortuna St
- 25501 Fortuna St
- 25620 Hayes Rd
- 25525 Hayes Blvd
- 25296 Hayes Rd
- 25515 Hayes Blvd
- 25535 Hayes Blvd
- 25621 Fortuna St
- 25617 Hayes Blvd
- 25650 Hayes Rd