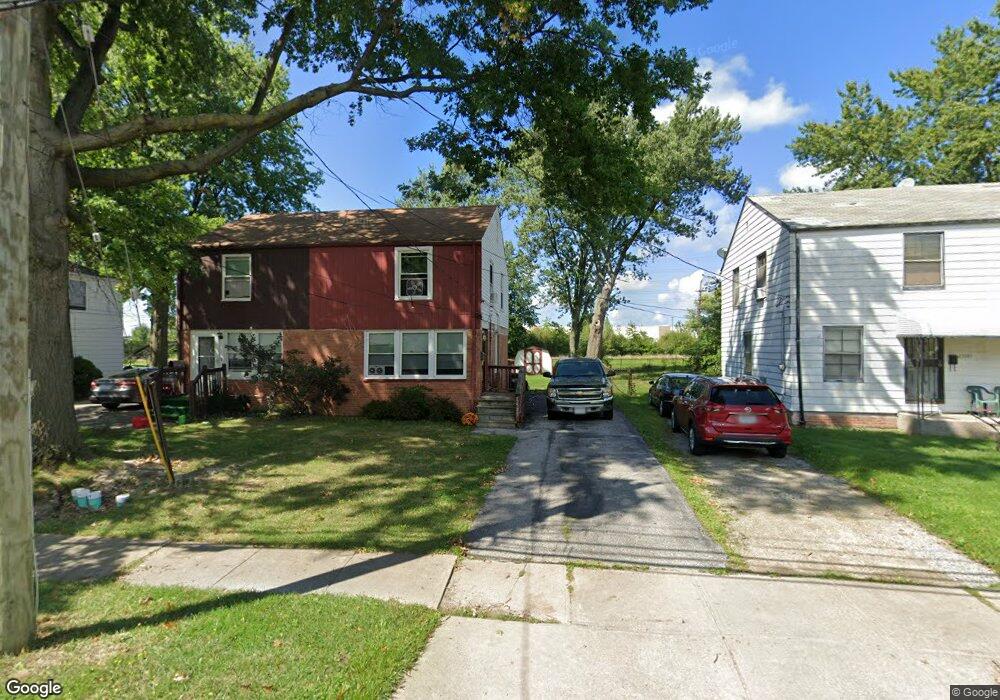
25585 Tungsten Rd Euclid, OH 44132
Estimated Value: $66,962 - $83,000
2
Beds
1
Bath
858
Sq Ft
$88/Sq Ft
Est. Value
About This Home
This home is located at 25585 Tungsten Rd, Euclid, OH 44132 and is currently estimated at $75,241, approximately $87 per square foot. 25585 Tungsten Rd is a home located in Cuyahoga County with nearby schools including Bluestone Elementary School, Euclid High School, and All Saints of St. John Vianney School.
Ownership History
Date
Name
Owned For
Owner Type
Purchase Details
Closed on
Feb 12, 2025
Sold by
Tmak Properties Llc and Tmak Property Llc
Bought by
Stylianos Fanoula Andromachi
Current Estimated Value
Purchase Details
Closed on
Sep 20, 2024
Sold by
Atwell Donald E
Bought by
Tmak Property Llc
Purchase Details
Closed on
Dec 12, 2015
Sold by
Dietz James R and Dietz Marjorie K
Bought by
Atwell Donald E
Purchase Details
Closed on
Sep 20, 2010
Sold by
Sportsjama Inc
Bought by
The Dietz Family Trust and Dietz James R
Purchase Details
Closed on
Jan 11, 2001
Sold by
Yeckley Linda L
Bought by
Sportsjama Inc
Purchase Details
Closed on
May 30, 1985
Sold by
Kebe Max F
Bought by
Yeckley Linda L
Purchase Details
Closed on
Apr 9, 1985
Sold by
Niedzialek W J
Bought by
Kebe Max F
Purchase Details
Closed on
Jan 1, 1975
Bought by
Niedzialek W J
Create a Home Valuation Report for This Property
The Home Valuation Report is an in-depth analysis detailing your home's value as well as a comparison with similar homes in the area
Home Values in the Area
Average Home Value in this Area
Purchase History
| Date | Buyer | Sale Price | Title Company |
|---|---|---|---|
| Stylianos Fanoula Andromachi | $73,500 | None Listed On Document | |
| Tmak Property Llc | $36,500 | None Listed On Document | |
| Atwell Donald E | $21,000 | Attorney | |
| The Dietz Family Trust | -- | Chicago Title Insurance Co | |
| Sportsjama Inc | $30,000 | Executive Title Agency Corp | |
| Yeckley Linda L | $28,500 | -- | |
| Kebe Max F | $20,500 | -- | |
| Niedzialek W J | -- | -- |
Source: Public Records
Tax History
| Year | Tax Paid | Tax Assessment Tax Assessment Total Assessment is a certain percentage of the fair market value that is determined by local assessors to be the total taxable value of land and additions on the property. | Land | Improvement |
|---|---|---|---|---|
| 2025 | $1,515 | $21,245 | $4,550 | $16,695 |
| 2024 | $1,535 | $21,245 | $4,550 | $16,695 |
| 2023 | $1,350 | $14,740 | $3,890 | $10,850 |
| 2022 | $1,321 | $14,735 | $3,885 | $10,850 |
| 2021 | $1,460 | $14,740 | $3,890 | $10,850 |
| 2020 | $1,239 | $11,170 | $2,940 | $8,230 |
| 2019 | $1,107 | $31,900 | $8,400 | $23,500 |
| 2018 | $1,109 | $11,170 | $2,940 | $8,230 |
| 2017 | $1,159 | $9,700 | $2,420 | $7,280 |
| 2016 | $1,187 | $9,700 | $2,420 | $7,280 |
| 2015 | $1,102 | $9,700 | $2,420 | $7,280 |
| 2014 | $1,262 | $11,420 | $2,840 | $8,580 |
Source: Public Records
Map
Nearby Homes
- 1471 Hall Ct
- 1437 E 252nd St
- 1530 E 254th St
- 1552 E 254th St
- 25161 Euclid Ave
- 24991 Euclid Ave
- 890 E 250th St
- 942 E 236th St
- 145 Richmond Rd
- 127 Brush Rd
- 797 Babbitt Rd Unit 15
- 24691 Hawthorne Dr
- 22931 Arms Ave
- 1670 Hillandale Dr
- 25641 Glenbrook Blvd
- 1790 Skyline Dr
- 825 E 256th St
- 25550 Glenbrook Blvd
- 24431 Hartland Rd
- 1807 Skyline Dr
- 25581 Tungsten Rd
- 25591 Tungsten Rd
- 25575 Tungsten Rd
- 25595 Tungsten Rd
- 25571 Tungsten Rd
- 25565 Tungsten Rd
- 25580 Tungsten Rd
- 25561 Tungsten Rd
- 25574 Tungsten Rd
- 25570 Tungsten Rd
- 25555 Tungsten Rd
- 1466 E 256th St
- 25564 Tungsten Rd
- 25560 Tungsten Rd
- 25551 Tungsten Rd
- 25611 Tungsten Rd
- 1468 E 256th St
- 25606 Tungsten Rd
- 25554 Tungsten Rd
- 25545 Tungsten Rd
Your Personal Tour Guide
Ask me questions while you tour the home.