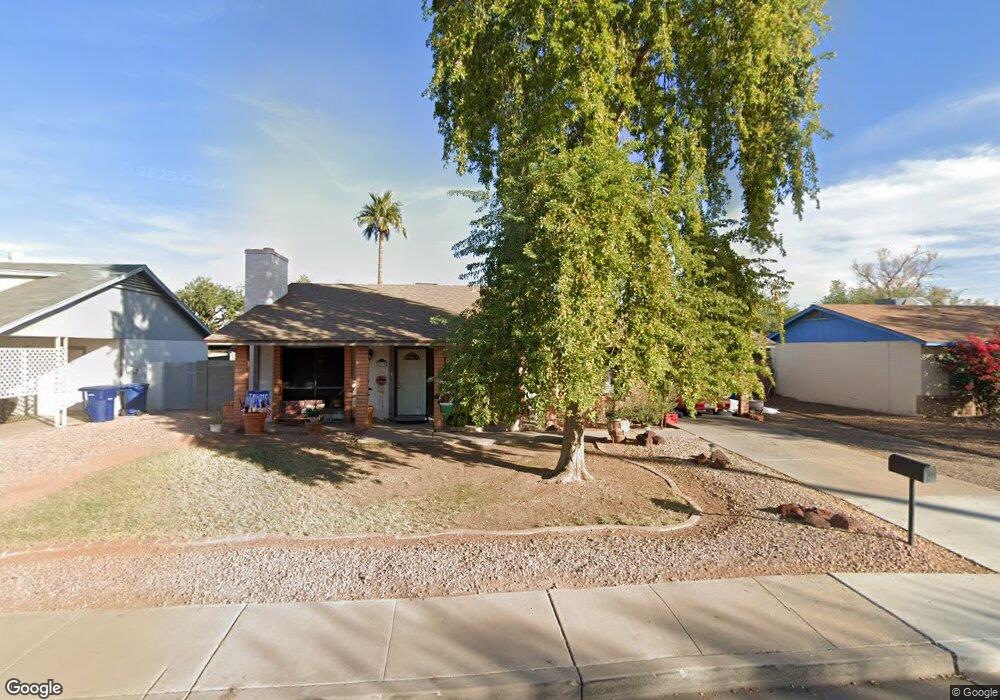
2559 E Coronita Cir Chandler, AZ 85225
East Chandler NeighborhoodEstimated Value: $335,756 - $428,000
--
Bed
2
Baths
1,304
Sq Ft
$296/Sq Ft
Est. Value
About This Home
This home is located at 2559 E Coronita Cir, Chandler, AZ 85225 and is currently estimated at $386,189, approximately $296 per square foot. 2559 E Coronita Cir is a home located in Maricopa County with nearby schools including Chandler Traditional Academy-Humphrey, Willis Junior High School, and Imagine West Gilbert Elementary School.
Ownership History
Date
Name
Owned For
Owner Type
Purchase Details
Closed on
Jul 8, 2024
Sold by
Denson Lori Lee
Bought by
Denson Lari Lee and Yancey Nicholas Lelan
Current Estimated Value
Purchase Details
Closed on
Jul 14, 2021
Sold by
Denson Dustin C
Bought by
Denson Lori Lee
Purchase Details
Closed on
Jul 22, 2017
Sold by
Denson Lori L
Bought by
Denson Dustin C
Purchase Details
Closed on
May 4, 2000
Sold by
Greis Paul
Bought by
Denson Lori L
Purchase Details
Closed on
Feb 3, 2000
Sold by
Denson Lori Lee
Bought by
Greis Paul
Purchase Details
Closed on
Sep 2, 1998
Sold by
Denson Norma B and Denson Charles F
Bought by
Denson Lori L
Purchase Details
Closed on
Apr 25, 1997
Sold by
Denson Lori L
Bought by
Denson Norma B and Denson Charles F
Purchase Details
Closed on
Jan 24, 1995
Sold by
Arvidson Chrisonne S
Bought by
Denson Lori
Create a Home Valuation Report for This Property
The Home Valuation Report is an in-depth analysis detailing your home's value as well as a comparison with similar homes in the area
Home Values in the Area
Average Home Value in this Area
Purchase History
| Date | Buyer | Sale Price | Title Company |
|---|---|---|---|
| Denson Lari Lee | -- | None Listed On Document | |
| Denson Lori Lee | -- | None Available | |
| Denson Dustin C | -- | None Available | |
| Denson Lori L | -- | -- | |
| Greis Paul | -- | -- | |
| Denson Lori L | -- | -- | |
| Denson Lori L | -- | -- | |
| Denson Norma B | -- | -- | |
| Denson Lori | $73,000 | -- |
Source: Public Records
Tax History Compared to Growth
Tax History
| Year | Tax Paid | Tax Assessment Tax Assessment Total Assessment is a certain percentage of the fair market value that is determined by local assessors to be the total taxable value of land and additions on the property. | Land | Improvement |
|---|---|---|---|---|
| 2025 | $1,001 | $12,850 | -- | -- |
| 2024 | $967 | $12,238 | -- | -- |
| 2023 | $967 | $27,110 | $5,420 | $21,690 |
| 2022 | $933 | $20,550 | $4,110 | $16,440 |
| 2021 | $978 | $19,570 | $3,910 | $15,660 |
| 2020 | $973 | $17,580 | $3,510 | $14,070 |
| 2019 | $936 | $15,420 | $3,080 | $12,340 |
| 2018 | $906 | $13,700 | $2,740 | $10,960 |
| 2017 | $845 | $12,270 | $2,450 | $9,820 |
| 2016 | $814 | $11,530 | $2,300 | $9,230 |
| 2015 | $789 | $10,730 | $2,140 | $8,590 |
Source: Public Records
Map
Nearby Homes
- 76 N 133rd St
- 15802 S Gilbert Rd Unit 58
- 15606 S Gilbert Rd Unit 128
- 252 N Wilson Dr
- 6 S 132nd St
- 2691 E Hulet Dr
- 2660 E Hulet Dr
- 2480 E Stephens Place
- 25 N Cottonwood St Unit 41
- 195 N Cottonwood St Unit 21
- 13640 E Williams Field Rd
- 124 S Cottonwood St
- 2214 E Frye Rd
- 28 E Joseph Way
- 382 N Ashley Dr
- 194 E Canyon Creek Dr
- 75 E Elgin St
- 2403 E San Tan St
- 140 E Pony Ln
- 2253 E Kempton Rd
- 2563 E Coronita Cir
- 2555 E Coronita Cir
- 2592 E Commonwealth Cir
- 2584 E Commonwealth Cir
- 2567 E Coronita Cir
- 2551 E Coronita Cir
- 2562 E Coronita Cir
- 2558 E Coronita Cir
- 2596 E Commonwealth Cir
- 2580 E Commonwealth Cir
- 2578 E Coronita Cir
- 2552 E Coronita Cir
- 2547 E Coronita Cir
- 2571 E Coronita Cir
- 2600 E Commonwealth Cir
- 2589 E Commonwealth Cir
- 2576 E Commonwealth Cir
- 109 N 133rd St
- 2582 E Coronita Cir