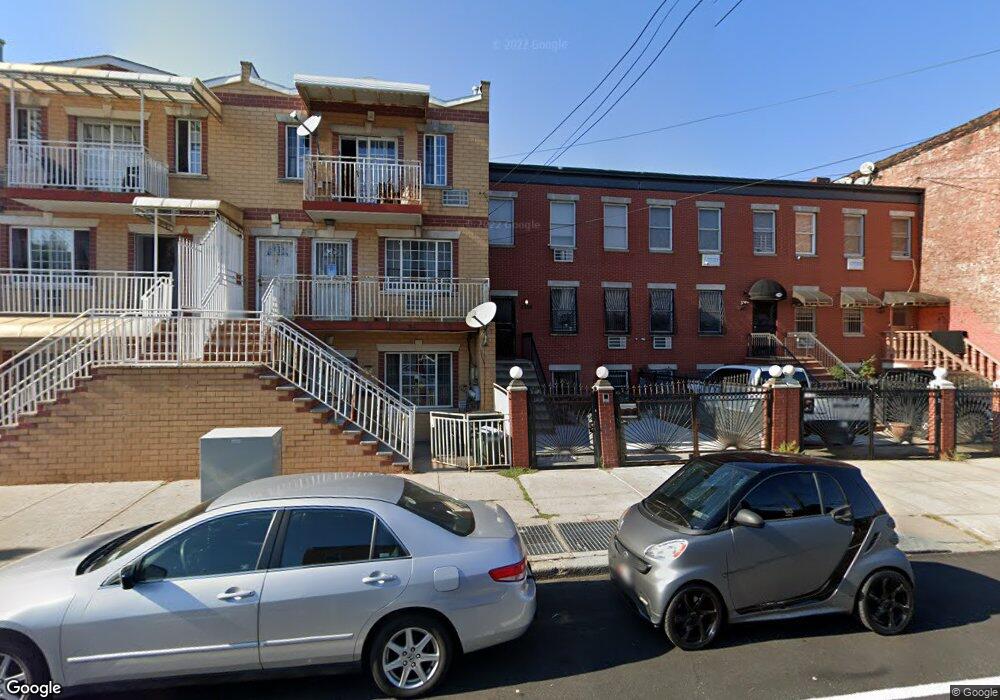
2559 Pitkin Ave Brooklyn, NY 11208
East New York NeighborhoodEstimated Value: $843,217 - $1,183,000
--
Bed
--
Bath
2,600
Sq Ft
$393/Sq Ft
Est. Value
About This Home
This home is located at 2559 Pitkin Ave, Brooklyn, NY 11208 and is currently estimated at $1,022,804, approximately $393 per square foot. 2559 Pitkin Ave is a home located in Kings County with nearby schools including P.S. 345 Patrolman Robert Bolden, Liberty Avenue Middle School, and Vista Academy.
Ownership History
Date
Name
Owned For
Owner Type
Purchase Details
Closed on
Dec 7, 2005
Sold by
Nyc Partnership Housing Development Fund
Bought by
Sanchez Andy
Current Estimated Value
Home Financials for this Owner
Home Financials are based on the most recent Mortgage that was taken out on this home.
Original Mortgage
$42,354
Outstanding Balance
$23,796
Interest Rate
6.36%
Estimated Equity
$999,008
Create a Home Valuation Report for This Property
The Home Valuation Report is an in-depth analysis detailing your home's value as well as a comparison with similar homes in the area
Home Values in the Area
Average Home Value in this Area
Purchase History
| Date | Buyer | Sale Price | Title Company |
|---|---|---|---|
| Sanchez Andy | $302,954 | -- | |
| Sanchez Andy | $302,954 | -- |
Source: Public Records
Mortgage History
| Date | Status | Borrower | Loan Amount |
|---|---|---|---|
| Open | Sanchez Andy | $42,354 | |
| Closed | Sanchez Andy | $42,354 | |
| Open | Sanchez Andy | $226,000 | |
| Closed | Sanchez Andy | $226,000 |
Source: Public Records
Tax History Compared to Growth
Tax History
| Year | Tax Paid | Tax Assessment Tax Assessment Total Assessment is a certain percentage of the fair market value that is determined by local assessors to be the total taxable value of land and additions on the property. | Land | Improvement |
|---|---|---|---|---|
| 2025 | $8,388 | $57,420 | $9,540 | $47,880 |
| 2024 | $8,388 | $50,040 | $9,540 | $40,500 |
| 2023 | $7,342 | $54,420 | $9,540 | $44,880 |
| 2022 | $6,057 | $48,900 | $9,540 | $39,360 |
| 2021 | $5,560 | $45,540 | $9,540 | $36,000 |
| 2020 | $2,239 | $55,200 | $9,540 | $45,660 |
| 2019 | $3,816 | $48,360 | $9,540 | $38,820 |
| 2018 | $3,645 | $32,832 | $7,909 | $24,923 |
| 2017 | $3,175 | $32,832 | $8,182 | $24,650 |
| 2016 | $2,720 | $31,672 | $9,090 | $22,582 |
| 2015 | $1,014 | $29,880 | $10,620 | $19,260 |
| 2014 | $1,014 | $29,001 | $10,105 | $18,896 |
Source: Public Records
Map
Nearby Homes
- 852 Glenmore Ave
- 170 Atkins Ave
- 184 Milford St
- 851 Glenmore Ave
- 210 Montauk Ave
- 210 Atkins Ave
- 228 Milford St
- 404 Logan St
- 447 Logan St
- 219 Berriman St
- 224 Berriman St
- 90 Milford St
- 341 Essex St
- 758 Glenmore Ave
- 73 Milford St
- 126 Crystal St
- 130 Crystal St
- 92 Fountain Ave
- 127 Crystal St
- 283 Shepherd Ave
- 2557 Pitkin Ave
- 2561 Pitkin Ave
- 2563 Pitkin Ave
- 2565 Pitkin Ave Unit 2
- 2565 Pitkin Ave
- 181 Montauk Ave
- 2553 Pitkin Ave
- 2569 Pitkin Ave
- 177 Montauk Ave
- 175 Montauk Ave
- 186 Milford St
- 2571 Pitkin Ave
- 2573 Pitkin Ave
- 173 Montauk Ave
- 190 Milford St
- 180 Milford St
- 171 Montauk Ave
- 2560 Pitkin Ave
- 178 Milford St
- 169 Montauk Ave