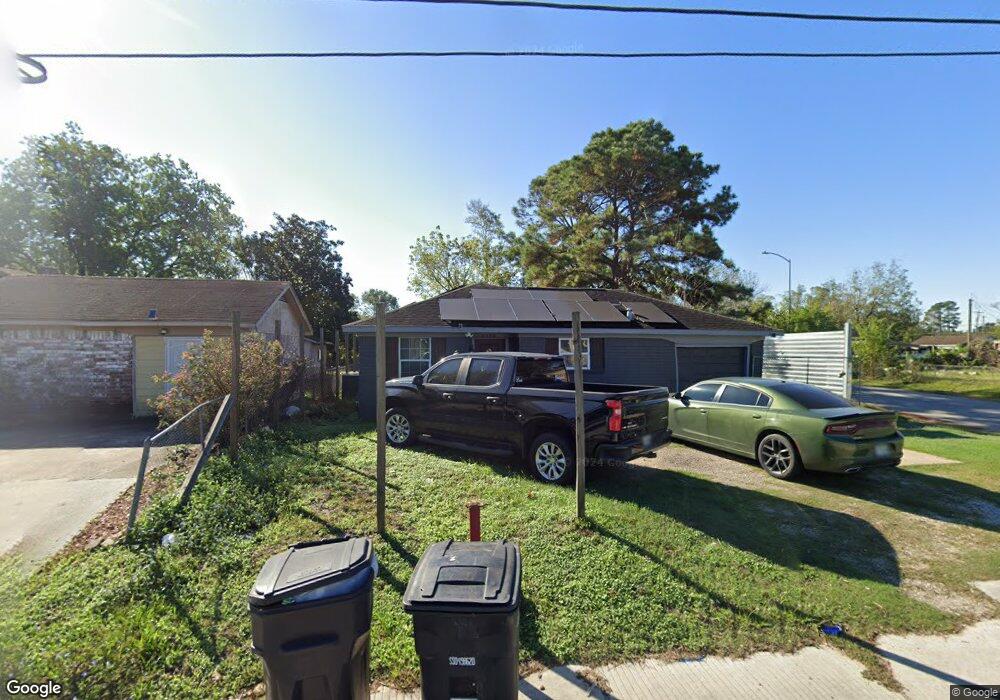
2559 W Little York Rd Houston, TX 77091
Acres Homes NeighborhoodEstimated Value: $152,066 - $228,000
3
Beds
1
Bath
1,028
Sq Ft
$183/Sq Ft
Est. Value
About This Home
This home is located at 2559 W Little York Rd, Houston, TX 77091 and is currently estimated at $188,017, approximately $182 per square foot. 2559 W Little York Rd is a home located in Harris County with nearby schools including Edward a Vines EC/Pre-K/K School, Harris Elementary School, and Hoffman Middle School.
Ownership History
Date
Name
Owned For
Owner Type
Purchase Details
Closed on
Dec 14, 2015
Sold by
W L Y Lp
Bought by
Casanova Gloria
Current Estimated Value
Home Financials for this Owner
Home Financials are based on the most recent Mortgage that was taken out on this home.
Original Mortgage
$77,000
Interest Rate
3.99%
Mortgage Type
Purchase Money Mortgage
Purchase Details
Closed on
Jun 3, 2015
Sold by
Mendez Aydee Paredes
Bought by
Assigned To Wly Partnership
Purchase Details
Closed on
Nov 5, 2010
Sold by
W L Y Partnership
Bought by
Mendez Aydee Paredes
Purchase Details
Closed on
Jul 7, 2010
Sold by
Jenkins Glenda Flowers
Bought by
W L Y Partnership
Purchase Details
Closed on
Mar 12, 1997
Sold by
W L Y Partnership
Bought by
Jenkins Glenda Flowers
Create a Home Valuation Report for This Property
The Home Valuation Report is an in-depth analysis detailing your home's value as well as a comparison with similar homes in the area
Home Values in the Area
Average Home Value in this Area
Purchase History
| Date | Buyer | Sale Price | Title Company |
|---|---|---|---|
| Casanova Gloria | -- | None Available | |
| Assigned To Wly Partnership | $52,287 | None Available | |
| Mendez Aydee Paredes | -- | None Available | |
| W L Y Partnership | $28,406 | None Available | |
| Jenkins Glenda Flowers | -- | -- |
Source: Public Records
Mortgage History
| Date | Status | Borrower | Loan Amount |
|---|---|---|---|
| Previous Owner | Casanova Gloria | $77,000 | |
| Closed | Jenkins Glenda Flowers | $0 |
Source: Public Records
Tax History Compared to Growth
Tax History
| Year | Tax Paid | Tax Assessment Tax Assessment Total Assessment is a certain percentage of the fair market value that is determined by local assessors to be the total taxable value of land and additions on the property. | Land | Improvement |
|---|---|---|---|---|
| 2025 | $296 | $127,232 | $51,035 | $76,197 |
| 2024 | $296 | $110,409 | $44,250 | $66,159 |
| 2023 | $296 | $99,740 | $44,250 | $55,490 |
| 2022 | $591 | $78,874 | $29,500 | $49,374 |
| 2021 | $562 | $22,386 | $10,325 | $12,061 |
| 2020 | $591 | $22,386 | $10,325 | $12,061 |
| 2019 | $619 | $22,386 | $10,325 | $12,061 |
| 2018 | $321 | $22,386 | $10,325 | $12,061 |
| 2017 | $594 | $22,386 | $10,325 | $12,061 |
| 2016 | $594 | $22,386 | $10,325 | $12,061 |
| 2015 | $334 | $22,386 | $10,325 | $12,061 |
| 2014 | $334 | $22,386 | $10,325 | $12,061 |
Source: Public Records
Map
Nearby Homes
- 2531 Walcott Ln
- 5734 White Magnolia St
- 2604 Areba St
- 2429 Calvin Ave
- 7050 Inwood Park Dr
- 7050 Inwood Park Dr Unit 113
- 2456 Walcott Ln
- 2703 Areba St
- 2622 Carmel St
- 2415 W Little York Rd Unit D
- 0 Dolly Wright St Unit 24865287
- 2448 Areba St
- 0 Areba St
- 2627 Carmel St
- 7413 Easter St
- 972 W Little York Rd
- 2407 Dolly Wright St
- 5815 Morehouse Ln
- 2643 Dalview St
- 2639 Dalview St
- 2555 W Little York Rd
- 2551 W Little York Rd
- 2567 W Little York Rd
- 2626 Garwood Dr
- 2622 Garwood Dr
- 2547 W Little York Rd
- 6911 Du Boise Rd
- 2618 Garwood Dr
- 2571 W Little York Rd
- 2550 W Little York Rd
- 2554 W Little York Rd
- 6907 Du Boise Rd
- 2546 W Little York Rd
- 2614 Garwood Dr
- 2543 W Little York Rd
- 2558 W Little York Rd
- Boise Rd
- 2542 W Little York Rd
- 6903 Du Boise Rd
- 2610 Garwood Dr