25596 Norman Rd NE Kingston, WA 98346
Estimated Value: $531,000 - $602,000
3
Beds
2
Baths
1,854
Sq Ft
$307/Sq Ft
Est. Value
About This Home
This home is located at 25596 Norman Rd NE, Kingston, WA 98346 and is currently estimated at $568,373, approximately $306 per square foot. 25596 Norman Rd NE is a home located in Kitsap County with nearby schools including Richard Gordon Elementary School, Kingston Middle School, and Kingston High School.
Ownership History
Date
Name
Owned For
Owner Type
Purchase Details
Closed on
Mar 2, 2015
Sold by
Tucker Kenneth R and Tucker Joanne R
Bought by
Morse Jessica A and Morse Robert S
Current Estimated Value
Home Financials for this Owner
Home Financials are based on the most recent Mortgage that was taken out on this home.
Original Mortgage
$10,000
Outstanding Balance
$7,619
Interest Rate
3.54%
Mortgage Type
Negative Amortization
Estimated Equity
$560,754
Purchase Details
Closed on
Feb 22, 2012
Sold by
Kennedy David and Kennedy Cathy
Bought by
Tucker Kenneth R and Tucker Joanne R
Purchase Details
Closed on
Feb 16, 2012
Sold by
Moran Rose A
Bought by
Kennedy David S
Purchase Details
Closed on
Oct 17, 2006
Sold by
Pratt Mary Joyce
Bought by
Pratt Augustine J
Purchase Details
Closed on
Aug 23, 2006
Sold by
Pratt Charles L
Bought by
Pratt Augustine J
Create a Home Valuation Report for This Property
The Home Valuation Report is an in-depth analysis detailing your home's value as well as a comparison with similar homes in the area
Home Values in the Area
Average Home Value in this Area
Purchase History
| Date | Buyer | Sale Price | Title Company |
|---|---|---|---|
| Morse Jessica A | $223,000 | Pacific Nw Title | |
| Tucker Kenneth R | $60,280 | Fidelity Ntl Kitsap County | |
| Kennedy David S | $60,280 | Fidelity Ntl Kitsap County | |
| Pratt Augustine J | -- | None Available | |
| Pratt Augustine J | -- | None Available |
Source: Public Records
Mortgage History
| Date | Status | Borrower | Loan Amount |
|---|---|---|---|
| Open | Morse Jessica A | $10,000 | |
| Open | Morse Jessica A | $218,960 |
Source: Public Records
Tax History Compared to Growth
Tax History
| Year | Tax Paid | Tax Assessment Tax Assessment Total Assessment is a certain percentage of the fair market value that is determined by local assessors to be the total taxable value of land and additions on the property. | Land | Improvement |
|---|---|---|---|---|
| 2026 | $4,000 | $497,380 | $142,670 | $354,710 |
| 2025 | $4,000 | $431,570 | $106,530 | $325,040 |
| 2024 | $3,871 | $431,570 | $106,530 | $325,040 |
| 2023 | $3,926 | $431,570 | $106,530 | $325,040 |
| 2022 | $3,510 | $365,990 | $90,440 | $275,550 |
| 2021 | $3,268 | $310,720 | $76,640 | $234,080 |
| 2020 | $3,303 | $310,720 | $76,640 | $234,080 |
| 2019 | $2,738 | $256,150 | $61,920 | $194,230 |
| 2018 | $2,532 | $212,810 | $53,730 | $159,080 |
| 2017 | $2,590 | $212,810 | $53,730 | $159,080 |
| 2016 | $2,509 | $188,980 | $51,170 | $137,810 |
| 2015 | $2,268 | $171,410 | $51,170 | $120,240 |
| 2014 | -- | $168,630 | $51,170 | $117,460 |
| 2013 | -- | $148,180 | $79,520 | $68,660 |
Source: Public Records
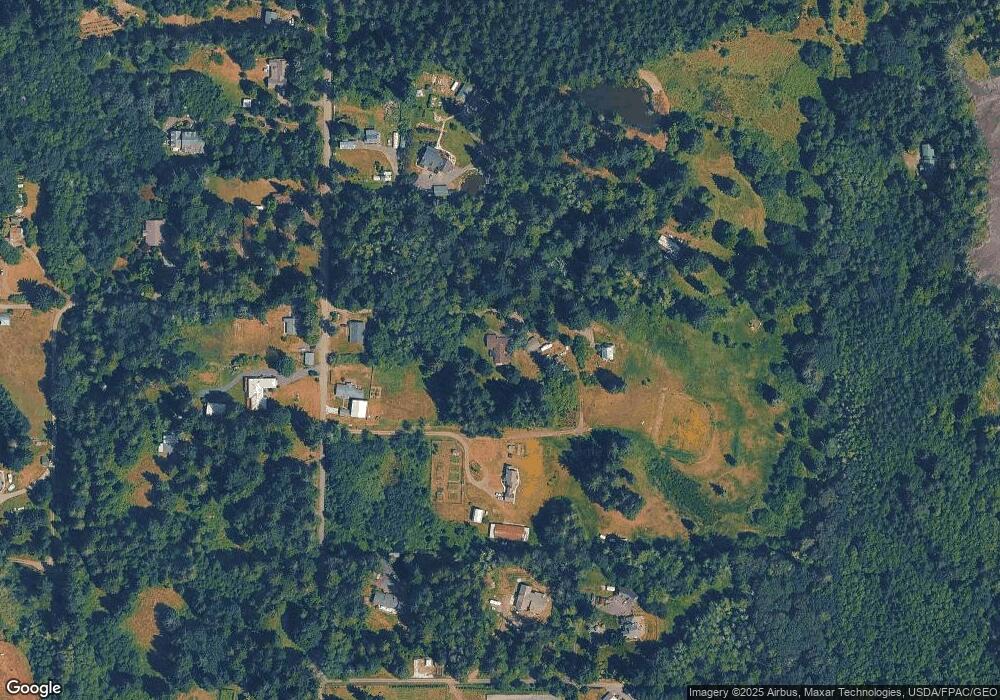
Map
Nearby Homes
- 10295 NE West Kingston Rd
- 10494 NE West Kingston Rd
- 23407 Marinwoon Circle Rd NE Unit 412
- 24515 Madura Dr NE
- 10809 NE West Kingston Rd
- 26124 NE James Ln
- 0 Barber Cut Off Rd NE
- 24115 Madura Dr NE
- 23466 Marinwood Cir NE Unit 1412
- 26216 Dungeness Ave NE Unit C130
- 24350 Madura Dr NE
- 23533 Arbors Terrace Rd NE Unit 3001
- 23491 Marinwood Cir NE Unit 1012
- 23497 Arbors Terrace Rd NE Unit 27
- 25825 Washington Blvd NE
- 25960 Central Ave NE
- 23467 Marinwood Cir NE Unit 812
- 23395 Marinwood Cir NE Unit 312
- 28 xxx NE State Highway 104
- 23731 Marinwood Cir NE Unit 2712
- 9621 NE Chuck Way
- 9639 NE Chuck Way
- 9657 NE Chuck Way
- 25584 Norman Rd NE
- 9603 NE Chuck Way
- 25200 Norman Rd NE
- 25170 Norman Rd NE
- 25295 Norman Rd NE
- 25209 Norman Rd NE
- 25840 Norman Rd NE
- 25454 Norman Rd NE
- 25199 Norman Rd NE
- 9674 NE Chuck Way
- 24874 Norman Rd NE
- 25846 Norman Rd NE
- 24863 Norman Rd NE
- 24900 Norman Rd NE
- 24773 Norman Rd NE
- 25293 Norman Rd NE
- 24765 Norman Rd NE