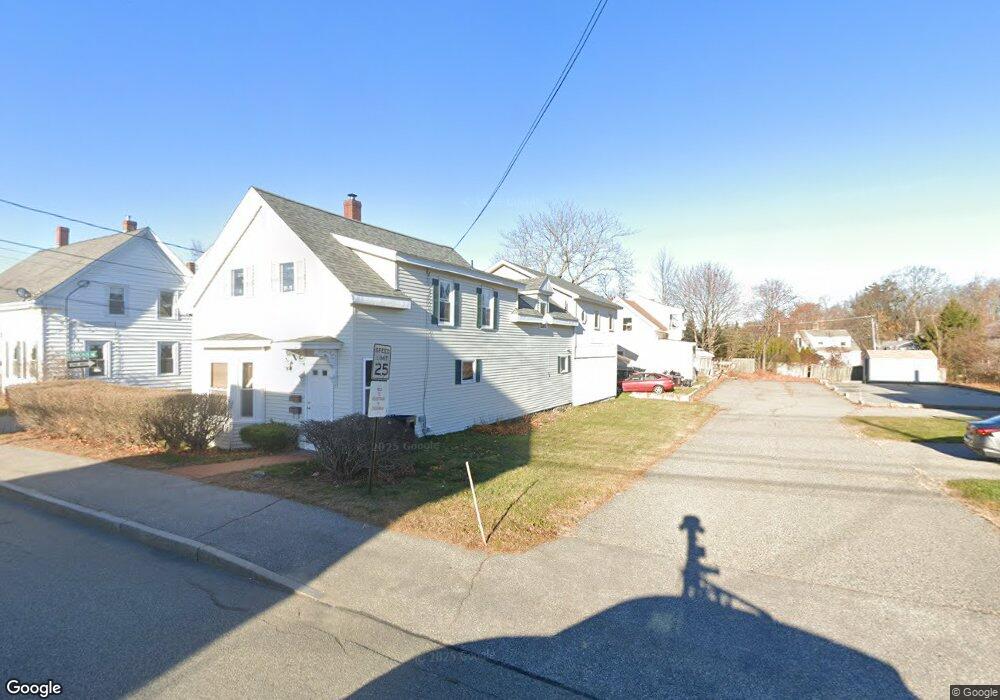
256 Alfred St Biddeford, ME 04005
Estimated Value: $364,318 - $533,000
3
Beds
2
Baths
2,191
Sq Ft
$204/Sq Ft
Est. Value
About This Home
This home is located at 256 Alfred St, Biddeford, ME 04005 and is currently estimated at $447,830, approximately $204 per square foot. 256 Alfred St is a home located in York County with nearby schools including John F Kennedy Memorial School, Biddeford Primary School, and Biddeford Intermediate School.
Ownership History
Date
Name
Owned For
Owner Type
Purchase Details
Closed on
Sep 2, 2005
Sold by
Taylor Colleen M and Taylor George J
Bought by
Panagakos Darren S
Current Estimated Value
Home Financials for this Owner
Home Financials are based on the most recent Mortgage that was taken out on this home.
Original Mortgage
$193,200
Outstanding Balance
$99,893
Interest Rate
5.81%
Mortgage Type
Purchase Money Mortgage
Estimated Equity
$347,937
Create a Home Valuation Report for This Property
The Home Valuation Report is an in-depth analysis detailing your home's value as well as a comparison with similar homes in the area
Home Values in the Area
Average Home Value in this Area
Purchase History
| Date | Buyer | Sale Price | Title Company |
|---|---|---|---|
| Panagakos Darren S | -- | -- |
Source: Public Records
Mortgage History
| Date | Status | Borrower | Loan Amount |
|---|---|---|---|
| Open | Panagakos Darren S | $193,200 |
Source: Public Records
Tax History
| Year | Tax Paid | Tax Assessment Tax Assessment Total Assessment is a certain percentage of the fair market value that is determined by local assessors to be the total taxable value of land and additions on the property. | Land | Improvement |
|---|---|---|---|---|
| 2025 | $4,146 | $277,500 | $132,600 | $144,900 |
| 2024 | $3,906 | $274,700 | $132,600 | $142,100 |
| 2023 | $3,604 | $274,700 | $132,600 | $142,100 |
| 2022 | $3,605 | $219,700 | $65,600 | $154,100 |
| 2021 | $3,391 | $186,000 | $54,700 | $131,300 |
| 2020 | $3,378 | $168,500 | $46,500 | $122,000 |
| 2019 | $3,367 | $168,500 | $46,500 | $122,000 |
| 2018 | $3,319 | $168,500 | $46,500 | $122,000 |
| 2017 | $3,193 | $159,100 | $46,500 | $112,600 |
| 2016 | $3,160 | $159,100 | $46,500 | $112,600 |
| 2015 | $2,903 | $159,100 | $46,500 | $112,600 |
| 2014 | $2,831 | $159,100 | $46,500 | $112,600 |
| 2013 | -- | $217,900 | $61,900 | $156,000 |
Source: Public Records
Map
Nearby Homes
Your Personal Tour Guide
Ask me questions while you tour the home.