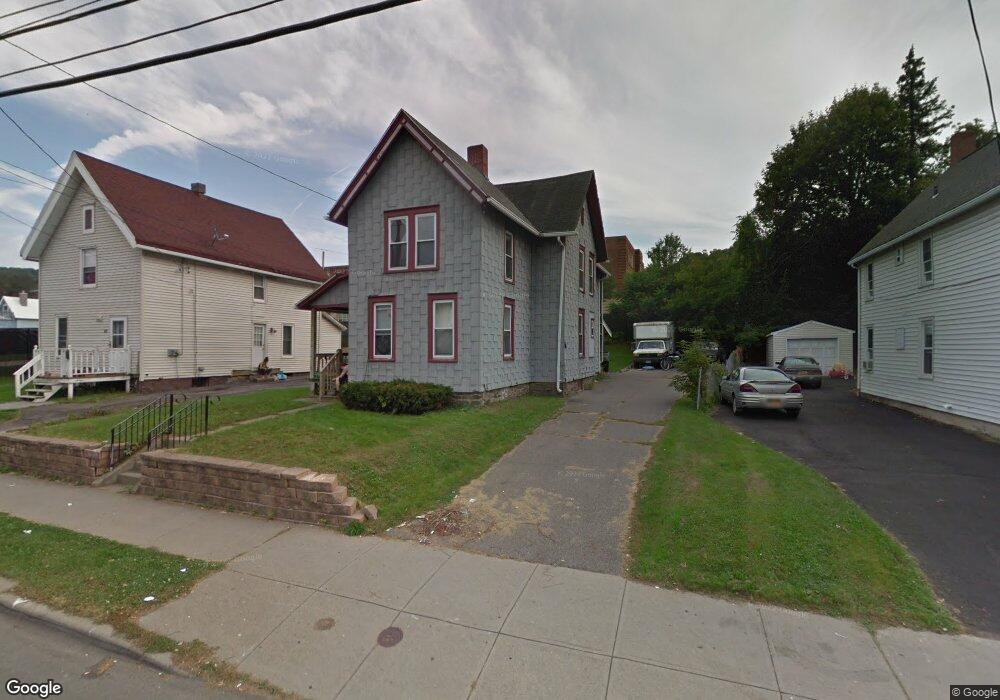
256 Conklin Ave Binghamton, NY 13903
Southside East Binghamton NeighborhoodEstimated Value: $108,932 - $145,000
3
Beds
2
Baths
1,496
Sq Ft
$82/Sq Ft
Est. Value
About This Home
This home is located at 256 Conklin Ave, Binghamton, NY 13903 and is currently estimated at $122,483, approximately $81 per square foot. 256 Conklin Ave is a home located in Broome County with nearby schools including Benjamin Franklin Elementary School, Binghamton High School, and East Middle School.
Ownership History
Date
Name
Owned For
Owner Type
Purchase Details
Closed on
Apr 10, 2025
Sold by
Brown Christopher T
Bought by
Bh45-205 Llc
Current Estimated Value
Purchase Details
Closed on
Mar 31, 2006
Sold by
Brewer James
Bought by
Nabinger Christopher
Home Financials for this Owner
Home Financials are based on the most recent Mortgage that was taken out on this home.
Original Mortgage
$52,155
Interest Rate
6.28%
Mortgage Type
New Conventional
Create a Home Valuation Report for This Property
The Home Valuation Report is an in-depth analysis detailing your home's value as well as a comparison with similar homes in the area
Home Values in the Area
Average Home Value in this Area
Purchase History
| Date | Buyer | Sale Price | Title Company |
|---|---|---|---|
| Bh45-205 Llc | $5,000 | None Listed On Document | |
| Bh45-205 Llc | $5,000 | None Listed On Document | |
| Nabinger Christopher | $54,900 | -- |
Source: Public Records
Mortgage History
| Date | Status | Borrower | Loan Amount |
|---|---|---|---|
| Previous Owner | Nabinger Christopher | $52,155 |
Source: Public Records
Tax History Compared to Growth
Tax History
| Year | Tax Paid | Tax Assessment Tax Assessment Total Assessment is a certain percentage of the fair market value that is determined by local assessors to be the total taxable value of land and additions on the property. | Land | Improvement |
|---|---|---|---|---|
| 2024 | $4,435 | $45,000 | $10,900 | $34,100 |
| 2023 | $4,354 | $45,000 | $10,900 | $34,100 |
| 2022 | $4,252 | $45,000 | $10,900 | $34,100 |
| 2021 | $4,204 | $45,000 | $10,900 | $34,100 |
| 2020 | $2,780 | $45,000 | $10,900 | $34,100 |
| 2019 | $1,419 | $45,000 | $10,900 | $34,100 |
| 2018 | $2,711 | $45,000 | $10,900 | $34,100 |
| 2017 | $2,875 | $45,000 | $10,900 | $34,100 |
| 2016 | $2,736 | $45,000 | $10,900 | $34,100 |
| 2015 | $2,430 | $45,000 | $10,900 | $34,100 |
| 2014 | $2,430 | $45,000 | $10,900 | $34,100 |
Source: Public Records
Map
Nearby Homes