
Seller's Agent in 2025
Osnat Levy
eXp Realty
(617) 833-1055
6 in this area
84 Total Sales
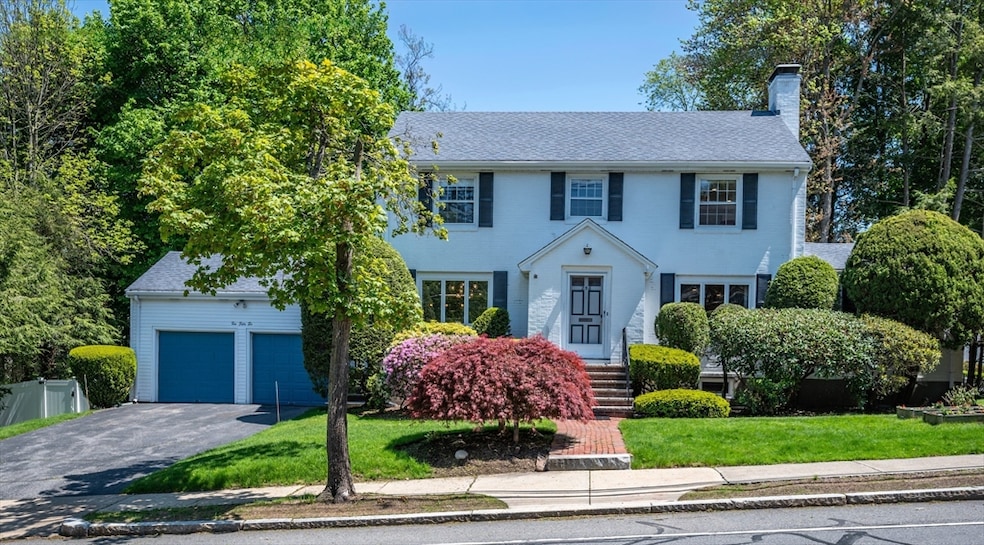
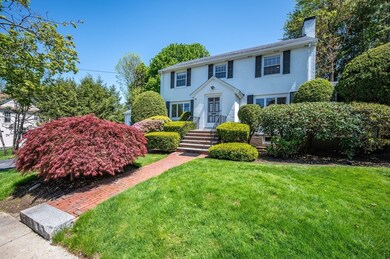

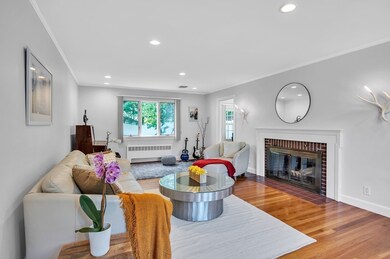

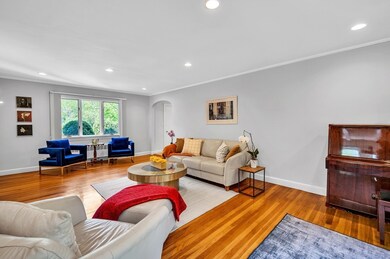

Fall in love with this lovely colonial perfectly sited on nearly 1/3 acre of flat, sun-drenched yard. This beautifully maintained home is airy, bright, and thoughtfully designed for modern living. The main level features a granite kitchen, elegant dining room, cozy living room with fireplace, spacious family room, and a charming three-season porch. Upstairs offers a luxurious primary suite and two generously sized bedrooms. The finished lower level includes a fabulous in-law suite with private entrance (2021)—ideal for guests, office, or media room. Major updates: roof (2016), central AC (2017), and outdoor spa hot tub (2021). This home truly has it all!
| Date | Type | Sale Price | Title Company |
|---|---|---|---|
| Deed | $1,575,000 | None Available | |
| Quit Claim Deed | $1,575,000 | None Available | |
| Deed | $760,000 | -- | |
| Deed | $760,000 | -- |
| Date | Status | Loan Amount | Loan Type |
|---|---|---|---|
| Open | $575,000 | Purchase Money Mortgage | |
| Closed | $575,000 | Purchase Money Mortgage | |
| Previous Owner | $100,000 | No Value Available | |
| Previous Owner | $156,000 | No Value Available |
| Date | Event | Price | List to Sale | Price per Sq Ft |
|---|---|---|---|---|
| 06/20/2025 06/20/25 | Sold | $1,575,000 | -0.6% | $523 / Sq Ft |
| 05/26/2025 05/26/25 | Pending | -- | -- | -- |
| 05/14/2025 05/14/25 | For Sale | $1,585,000 | -- | $527 / Sq Ft |
| Year | Tax Paid | Tax Assessment Tax Assessment Total Assessment is a certain percentage of the fair market value that is determined by local assessors to be the total taxable value of land and additions on the property. | Land | Improvement |
|---|---|---|---|---|
| 2025 | $13,860 | $1,414,300 | $1,028,200 | $386,100 |
| 2024 | $13,401 | $1,373,100 | $998,300 | $374,800 |
| 2023 | $12,928 | $1,269,900 | $778,000 | $491,900 |
| 2022 | $12,016 | $1,142,200 | $720,400 | $421,800 |
| 2021 | $11,594 | $1,077,500 | $679,600 | $397,900 |
| 2020 | $11,249 | $1,077,500 | $679,600 | $397,900 |
| 2019 | $10,932 | $1,046,100 | $659,800 | $386,300 |
| 2018 | $10,582 | $978,000 | $601,200 | $376,800 |
| 2017 | $10,259 | $922,600 | $567,200 | $355,400 |
| 2016 | $9,605 | $844,000 | $530,100 | $313,900 |
| 2015 | $9,158 | $788,800 | $495,400 | $293,400 |
Seller's Agent in 2025
Osnat Levy
eXp Realty
(617) 833-1055
6 in this area
84 Total Sales
Buyer's Agent in 2025
Anne Kennedy
Coldwell Banker Realty - Newton
(617) 549-1832
1 in this area
103 Total Sales
Source: MLS Property Information Network (MLS PIN)
MLS Number: 73374237
APN: NEWT-000081-000019-000018
Disclaimer: Certain information contained herein is derived from information provided by parties other than Homes.com. All information provided is deemed reliable, but is not guaranteed to be accurate and should be independently verified.
![]() The property listing data and information, or the Images, set forth herein were provided to MLS Property Information Network, Inc. from third party sources, including sellers, lessors and public records, and were compiled by MLS Property Information Network, Inc. The property listing data and information, and the Images, are for the personal, non-commercial use of consumers having a good faith interest in purchasing or leasing listed properties of the type displayed to them and may not be used for any purpose other than to identify prospective properties which such consumers may have a good faith interest in purchasing or leasing. MLS Property Information Network, Inc. and its subscribers disclaim any and all representations and warranties as to the accuracy of the property listing data and information, or as to the accuracy of any of the Images, set forth herein.
The property listing data and information, or the Images, set forth herein were provided to MLS Property Information Network, Inc. from third party sources, including sellers, lessors and public records, and were compiled by MLS Property Information Network, Inc. The property listing data and information, and the Images, are for the personal, non-commercial use of consumers having a good faith interest in purchasing or leasing listed properties of the type displayed to them and may not be used for any purpose other than to identify prospective properties which such consumers may have a good faith interest in purchasing or leasing. MLS Property Information Network, Inc. and its subscribers disclaim any and all representations and warranties as to the accuracy of the property listing data and information, or as to the accuracy of any of the Images, set forth herein.