Estimated Value: $97,857 - $123,000
2
Beds
1
Bath
1,232
Sq Ft
$89/Sq Ft
Est. Value
About This Home
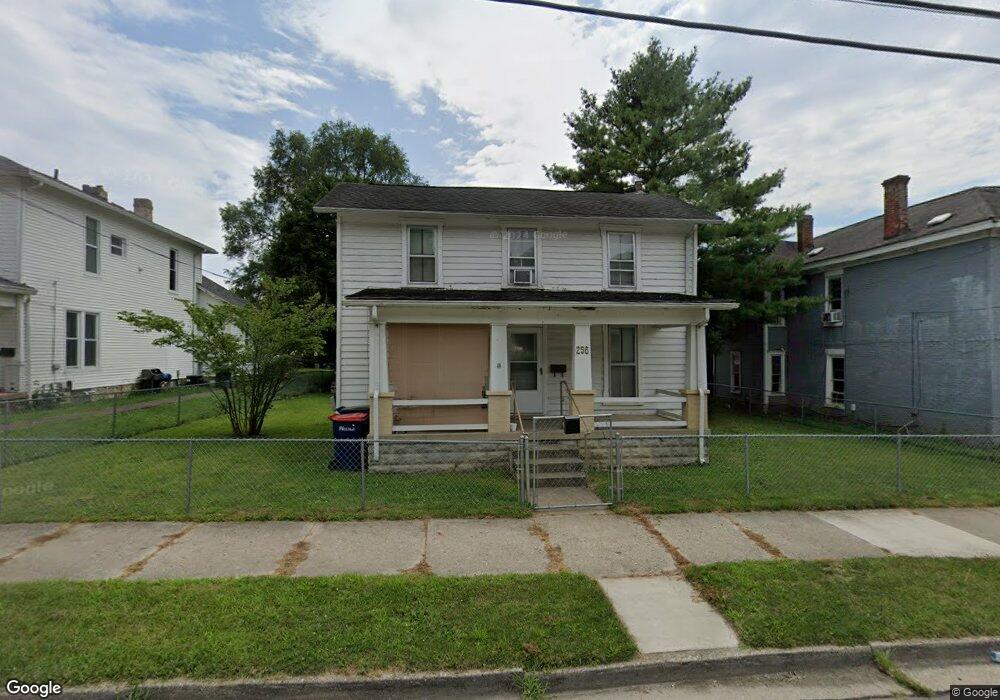
This home is located at 256 E Main St, Piqua, OH 45356 and is currently estimated at $109,214, approximately $88 per square foot. 256 E Main St is a home located in Miami County with nearby schools including Piqua Junior High School, Piqua High School, and Nicholas School.
Ownership History
Date
Name
Owned For
Owner Type
Purchase Details
Closed on
Aug 5, 2020
Sold by
Mcnabb John Stephen and Mcnabb Sara Ruth
Bought by
Bim Merle Iii Robert W and Bim Merle Angela
Current Estimated Value
Purchase Details
Closed on
Aug 20, 2015
Sold by
Mcnabb John Stephen and Mcnabb Sara Ruth
Bought by
Bim Merle Iii Robert W and Bim Merle Angela
Home Financials for this Owner
Home Financials are based on the most recent Mortgage that was taken out on this home.
Original Mortgage
$19,900
Interest Rate
3.25%
Mortgage Type
Seller Take Back
Purchase Details
Closed on
Mar 1, 1981
Bought by
Mcnabb John Stephen
Create a Home Valuation Report for This Property
The Home Valuation Report is an in-depth analysis detailing your home's value as well as a comparison with similar homes in the area
Home Values in the Area
Average Home Value in this Area
Purchase History
| Date | Buyer | Sale Price | Title Company |
|---|---|---|---|
| Bim Merle Iii Robert W | $29,900 | None Available | |
| Bim Merle Iii Robert W | $29,900 | Attorney | |
| Mcnabb John Stephen | $12,000 | -- |
Source: Public Records
Mortgage History
| Date | Status | Borrower | Loan Amount |
|---|---|---|---|
| Previous Owner | Bim Merle Iii Robert W | $19,900 |
Source: Public Records
Tax History
| Year | Tax Paid | Tax Assessment Tax Assessment Total Assessment is a certain percentage of the fair market value that is determined by local assessors to be the total taxable value of land and additions on the property. | Land | Improvement |
|---|---|---|---|---|
| 2024 | $1,183 | $20,690 | $7,700 | $12,990 |
| 2023 | $971 | $20,690 | $7,700 | $12,990 |
| 2022 | $937 | $20,690 | $7,700 | $12,990 |
| 2021 | $855 | $17,230 | $6,410 | $10,820 |
| 2020 | $822 | $17,230 | $6,410 | $10,820 |
| 2019 | $826 | $17,230 | $6,410 | $10,820 |
| 2018 | $764 | $15,130 | $5,360 | $9,770 |
| 2017 | $772 | $15,130 | $5,360 | $9,770 |
| 2016 | $764 | $15,130 | $5,360 | $9,770 |
| 2015 | $726 | $14,000 | $4,970 | $9,030 |
| 2014 | $726 | $14,000 | $4,970 | $9,030 |
| 2013 | $729 | $14,000 | $4,970 | $9,030 |
Source: Public Records
Map
Nearby Homes
Your Personal Tour Guide
Ask me questions while you tour the home.