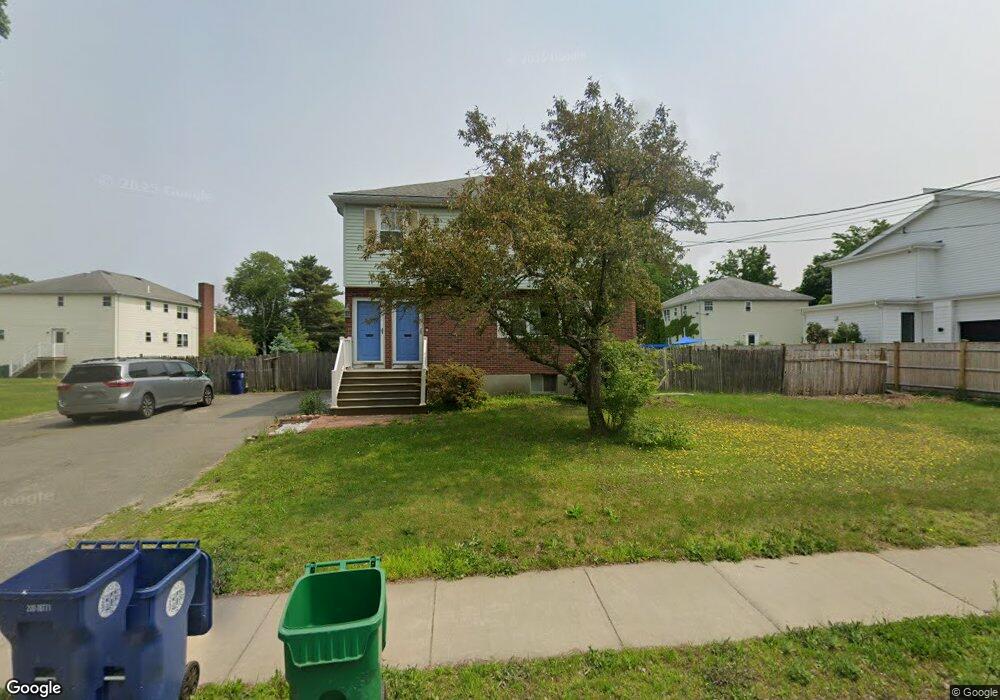
256 Lagrange St Unit 258 Chestnut Hill, MA 02467
Oak Hill NeighborhoodEstimated Value: $815,000 - $1,867,000
3
Beds
2
Baths
1,190
Sq Ft
$1,224/Sq Ft
Est. Value
About This Home
This home is located at 256 Lagrange St Unit 258, Chestnut Hill, MA 02467 and is currently estimated at $1,455,991, approximately $1,223 per square foot. 256 Lagrange St Unit 258 is a home located in Middlesex County with nearby schools including Memorial Spaulding Elementary School, Oak Hill Middle School, and Newton South High School.
Ownership History
Date
Name
Owned For
Owner Type
Purchase Details
Closed on
Feb 24, 2025
Sold by
Yam Winnie
Bought by
Li Sam P and Li You M
Current Estimated Value
Purchase Details
Closed on
May 21, 2008
Sold by
Johnson-Mccarren Cheryl
Bought by
Li Jun and Li Miao Chang
Home Financials for this Owner
Home Financials are based on the most recent Mortgage that was taken out on this home.
Original Mortgage
$495,000
Interest Rate
5.94%
Mortgage Type
Purchase Money Mortgage
Purchase Details
Closed on
Jun 28, 2001
Sold by
Newrow Dolores and Newrow Rhoda
Bought by
Johnson Cheryl A
Home Financials for this Owner
Home Financials are based on the most recent Mortgage that was taken out on this home.
Original Mortgage
$500,000
Interest Rate
7.14%
Mortgage Type
Purchase Money Mortgage
Create a Home Valuation Report for This Property
The Home Valuation Report is an in-depth analysis detailing your home's value as well as a comparison with similar homes in the area
Home Values in the Area
Average Home Value in this Area
Purchase History
| Date | Buyer | Sale Price | Title Company |
|---|---|---|---|
| Li Sam P | -- | None Available | |
| Li Sam P | -- | None Available | |
| Li Jun | $660,000 | -- | |
| Li Jun | $660,000 | -- | |
| Johnson Cheryl A | $655,000 | -- |
Source: Public Records
Mortgage History
| Date | Status | Borrower | Loan Amount |
|---|---|---|---|
| Previous Owner | Li Jun | $495,000 | |
| Previous Owner | Johnson Cheryl A | $500,000 | |
| Previous Owner | Johnson Cheryl A | $60,000 | |
| Previous Owner | Johnson Cheryl A | $125,000 |
Source: Public Records
Tax History Compared to Growth
Tax History
| Year | Tax Paid | Tax Assessment Tax Assessment Total Assessment is a certain percentage of the fair market value that is determined by local assessors to be the total taxable value of land and additions on the property. | Land | Improvement |
|---|---|---|---|---|
| 2025 | $11,794 | $1,203,500 | $914,900 | $288,600 |
| 2024 | $11,404 | $1,168,400 | $888,300 | $280,100 |
| 2023 | $10,955 | $1,076,100 | $725,400 | $350,700 |
| 2022 | $10,482 | $996,400 | $671,700 | $324,700 |
| 2021 | $9,836 | $914,100 | $616,200 | $297,900 |
| 2020 | $9,543 | $914,100 | $616,200 | $297,900 |
| 2019 | $8,927 | $854,300 | $575,900 | $278,400 |
| 2018 | $9,000 | $831,800 | $546,000 | $285,800 |
| 2017 | $8,486 | $763,100 | $500,900 | $262,200 |
| 2016 | $7,967 | $700,100 | $459,500 | $240,600 |
| 2015 | $7,596 | $654,300 | $429,400 | $224,900 |
Source: Public Records
Map
Nearby Homes
- 64 Bryon Rd Unit 1
- 21 Westgate Rd Unit 6
- 23 Westgate Rd Unit 6
- 24 Westgate Rd Unit 2
- 28 Westgate Rd Unit 3
- 40 Westgate Rd Unit 5
- 56 Broadlawn Park Unit 512
- 50-56 Broadlawn Park Unit 221
- 69 Princeton Rd
- 109 Harwich Rd
- 22 Scotney Rd
- 1307 Lagrange St Unit 1307
- 65 Lagrange St
- 931 Lagrange St
- 50 Grace Rd
- 139 Newfield St
- 34 Lagrange St
- 171 Shaw Rd
- 97 Anderer Ln Unit 105
- 18 Wolcott Rd
- 256 Lagrange St
- 256 Lagrange St Unit 2nd Floor
- 256-258 Lagrange St
- 266 Lagrange St Unit 266
- 264 Lagrange St Unit 266
- 264 Lagrange St Unit U264
- 37 Bryon Rd Unit 39
- 45-47 Bryon Rd
- 45 Bryon Rd Unit 47
- 70 Bryant Rd Unit 3
- 70 Bryant Rd Unit 4
- 52 Bryant Rd Unit 6
- 52 Bryant Rd Unit 1
- 272 Lagrange St
- 272 Lagrange St Unit 1
- 69 Bryon Rd Unit 71
- 274 Lagrange St
- 274 Lagrange St Unit 1
- 2A Bryon Rd Unit 2A
- 36 Bryon Rd Unit 1