256 Loch Way Eatonton, GA 31024
Estimated Value: $1,169,548 - $1,309,000
--
Bed
3
Baths
2,216
Sq Ft
$555/Sq Ft
Est. Value
About This Home
This home is located at 256 Loch Way, Eatonton, GA 31024 and is currently estimated at $1,230,137, approximately $555 per square foot. 256 Loch Way is a home located in Putnam County with nearby schools including Putnam County Primary School, Putnam County Elementary School, and Putnam County Middle School.
Ownership History
Date
Name
Owned For
Owner Type
Purchase Details
Closed on
Jul 12, 2024
Sold by
Bowen Harvey R
Bought by
Bowen Harvey R
Current Estimated Value
Purchase Details
Closed on
Jun 12, 1997
Sold by
Daniel Richard A
Bought by
Bowen Harvey R and Bowen Fay
Purchase Details
Closed on
Jan 21, 1997
Sold by
Embry Ruth N
Bought by
Daniel Richard A
Purchase Details
Closed on
Dec 15, 1994
Sold by
Embry Terrell J
Bought by
Embry Ruth N
Purchase Details
Closed on
Nov 23, 1994
Sold by
Walton Walton W and Walton Dooley
Bought by
Embry Terrell J
Create a Home Valuation Report for This Property
The Home Valuation Report is an in-depth analysis detailing your home's value as well as a comparison with similar homes in the area
Home Values in the Area
Average Home Value in this Area
Purchase History
| Date | Buyer | Sale Price | Title Company |
|---|---|---|---|
| Bowen Harvey R | -- | -- | |
| Bowen Harvey R | $69,000 | -- | |
| Daniel Richard A | $65,000 | -- | |
| Embry Ruth N | $22,500 | -- | |
| Embry Terrell J | $22,500 | -- |
Source: Public Records
Tax History Compared to Growth
Tax History
| Year | Tax Paid | Tax Assessment Tax Assessment Total Assessment is a certain percentage of the fair market value that is determined by local assessors to be the total taxable value of land and additions on the property. | Land | Improvement |
|---|---|---|---|---|
| 2024 | $2,959 | $412,161 | $160,000 | $252,161 |
| 2023 | $3,106 | $317,202 | $148,000 | $169,202 |
| 2022 | $3,434 | $285,340 | $140,000 | $145,340 |
| 2021 | $3,903 | $231,300 | $100,000 | $131,300 |
| 2020 | $4,158 | $218,680 | $90,000 | $128,680 |
| 2019 | $4,228 | $204,365 | $90,000 | $114,365 |
| 2018 | $4,197 | $189,804 | $99,000 | $90,804 |
| 2017 | $3,674 | $172,949 | $90,000 | $82,949 |
| 2016 | $3,678 | $172,949 | $90,000 | $82,949 |
| 2015 | $3,545 | $172,949 | $90,000 | $82,949 |
| 2014 | $3,551 | $172,949 | $90,000 | $82,949 |
Source: Public Records
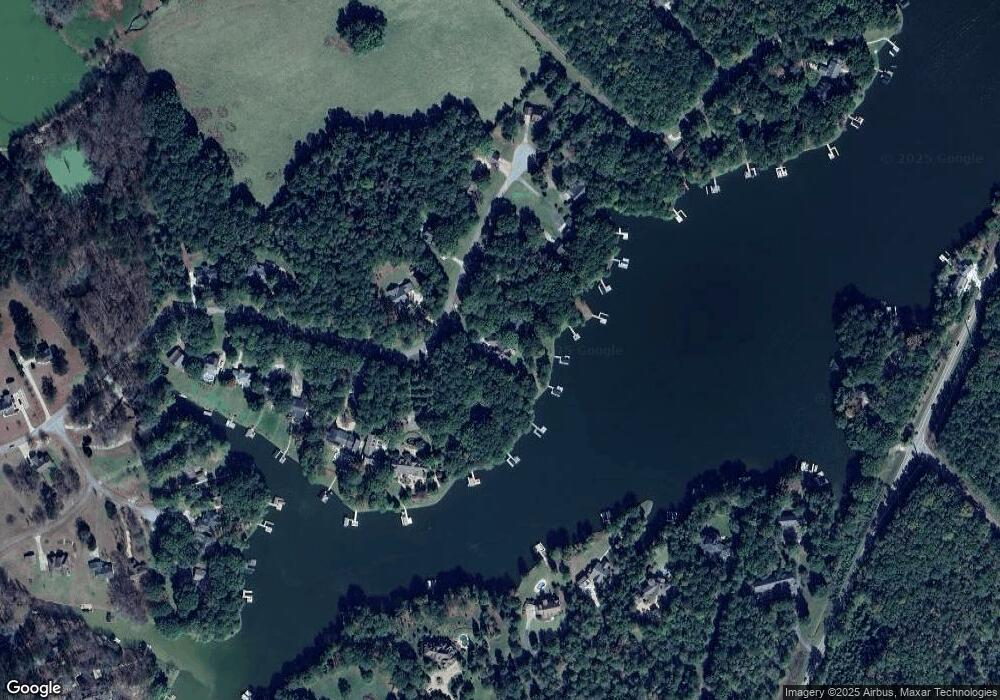
Map
Nearby Homes