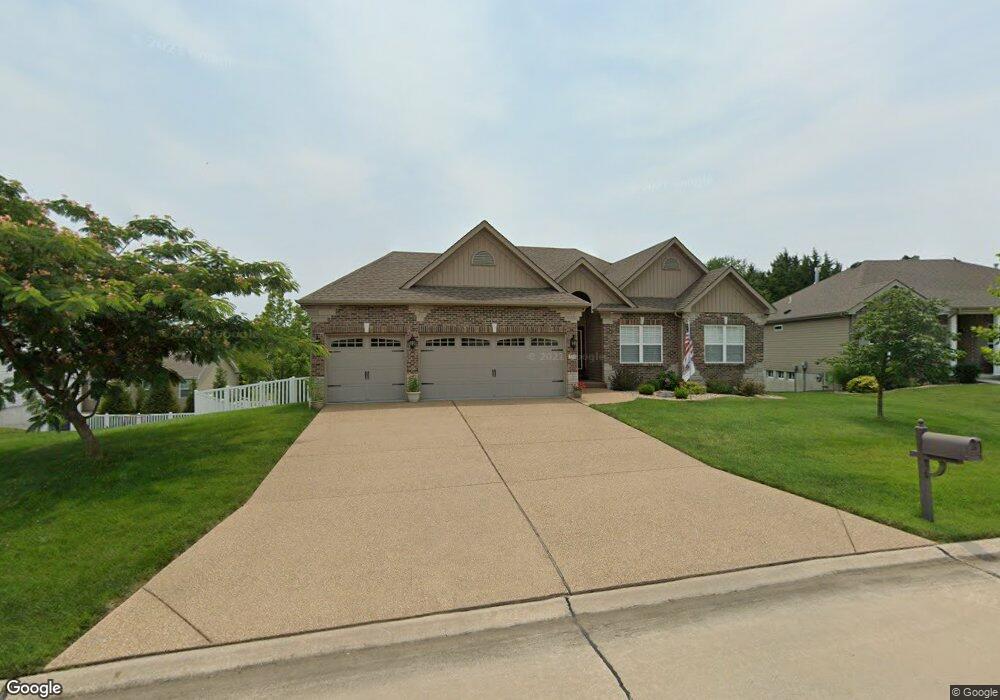
256 Mason Glen Dr Lake Saint Louis, MO 63367
Estimated Value: $501,000 - $663,000
4
Beds
3
Baths
2,195
Sq Ft
$253/Sq Ft
Est. Value
About This Home
This home is located at 256 Mason Glen Dr, Lake Saint Louis, MO 63367 and is currently estimated at $554,367, approximately $252 per square foot. 256 Mason Glen Dr is a home located in St. Charles County with nearby schools including Duello Elementary School, Wentzville South Middle School, and Timberland High School.
Ownership History
Date
Name
Owned For
Owner Type
Purchase Details
Closed on
Nov 8, 2013
Sold by
Schlosser David M and Schlosser Danielle L
Bought by
Wirtz David F and Wirtz Frances M
Current Estimated Value
Purchase Details
Closed on
Feb 20, 2009
Sold by
Milli Quality Home Construction & Develo
Bought by
Schlosser David M and Schlosser Danielle L
Home Financials for this Owner
Home Financials are based on the most recent Mortgage that was taken out on this home.
Original Mortgage
$251,846
Interest Rate
4.92%
Mortgage Type
Purchase Money Mortgage
Purchase Details
Closed on
Aug 29, 2008
Sold by
Johnson Yust Development Co Inc
Bought by
Mill Quality Home Construction & Develop
Home Financials for this Owner
Home Financials are based on the most recent Mortgage that was taken out on this home.
Original Mortgage
$221,298
Interest Rate
6.66%
Mortgage Type
Construction
Create a Home Valuation Report for This Property
The Home Valuation Report is an in-depth analysis detailing your home's value as well as a comparison with similar homes in the area
Home Values in the Area
Average Home Value in this Area
Purchase History
| Date | Buyer | Sale Price | Title Company |
|---|---|---|---|
| Wirtz David F | $305,000 | None Available | |
| Schlosser David M | -- | None Available | |
| Mill Quality Home Construction & Develop | -- | Ort |
Source: Public Records
Mortgage History
| Date | Status | Borrower | Loan Amount |
|---|---|---|---|
| Previous Owner | Schlosser David M | $251,846 | |
| Previous Owner | Mill Quality Home Construction & Develop | $221,298 |
Source: Public Records
Tax History Compared to Growth
Tax History
| Year | Tax Paid | Tax Assessment Tax Assessment Total Assessment is a certain percentage of the fair market value that is determined by local assessors to be the total taxable value of land and additions on the property. | Land | Improvement |
|---|---|---|---|---|
| 2025 | $5,736 | $88,575 | -- | -- |
| 2023 | $5,736 | $84,597 | $0 | $0 |
| 2022 | $4,600 | $67,725 | $0 | $0 |
| 2021 | $4,605 | $67,725 | $0 | $0 |
| 2020 | $4,330 | $61,081 | $0 | $0 |
| 2019 | $4,019 | $61,081 | $0 | $0 |
| 2018 | $4,059 | $58,784 | $0 | $0 |
| 2017 | $4,058 | $58,784 | $0 | $0 |
| 2016 | $4,001 | $55,539 | $0 | $0 |
| 2015 | $3,948 | $55,539 | $0 | $0 |
| 2014 | $3,091 | $46,656 | $0 | $0 |
Source: Public Records
Map
Nearby Homes
- 103 Eckstein Ln
- 209 Wyndemere Ln
- 237 Mason Glen Dr
- 114 Brookfield Crossing Dr
- 339 Wyndemere Dr
- 427 Parkgate Dr
- 422 Parkgate Dr
- 113 Wyndcrest Ct
- 8085 Glen Arbor Dr
- 2 Maple at Harvest Manors
- 554 Wheatfield Cir
- 235 Greengate Dr
- 1 Wyndham E5 @ Harvest Heritage
- Devonshire Plan at Harvest - Cottage Collection
- Windsor Plan at Harvest - Cottage Collection
- Dover Plan at Harvest - Cottage Collection
- 2 Berwick at Harvest Manors
- 503 Wheatfield Cir
- 2 Sterling at Harvest Manors
- Lansford 3-Car Plan at Post Farms - The Villages at Post Farms Manors 3-Car
- 254 Mason Glen Dr
- 500 Mason Creek Dr
- 502 Mason Creek Dr
- 504 Mason Creek Dr
- 255 Mason Glen Dr
- 252 Mason Glen Dr
- 257 Mason Glen Dr
- 253 Mason Glen Dr
- 506 Mason Creek Dr
- 250 Mason Glen Dr
- 300 Mason Glen Dr
- 51 Mason Cir
- 416 Mason Creek Dr
- 508 Mason Creek Dr
- 251 Mason Glen Dr
- 301 Mason Glen Dr
- 248 Mason Glen Dr
- 53 Mason Cir
- 414 Mason Creek Dr
- 302 Mason Glen Dr