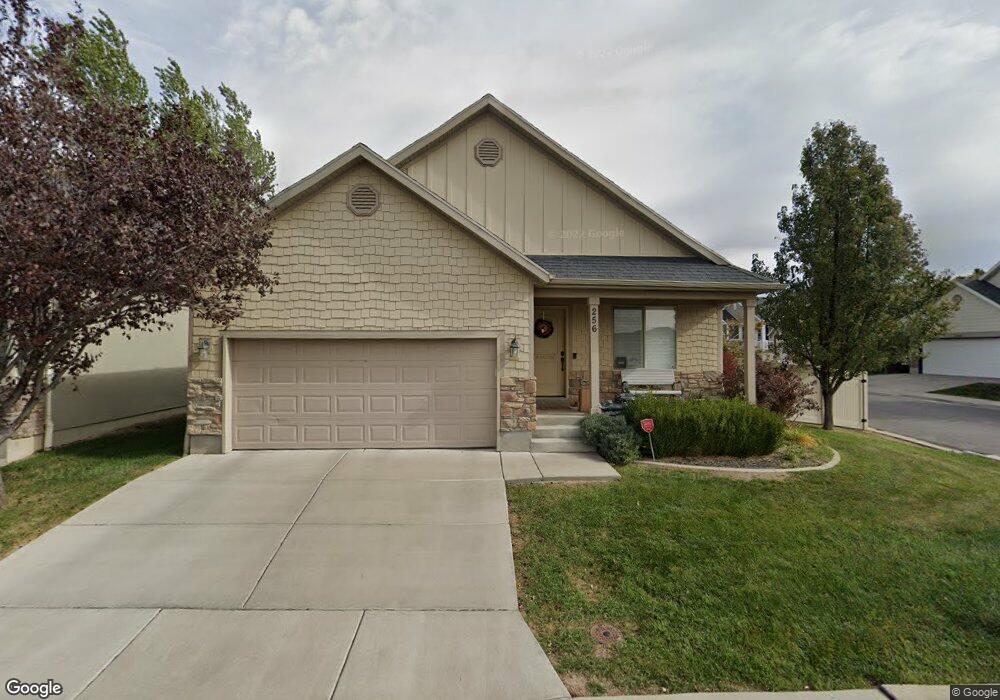
256 N 1075 W Clearfield, UT 84015
Estimated Value: $510,000 - $539,000
4
Beds
3
Baths
3,369
Sq Ft
$156/Sq Ft
Est. Value
About This Home
This home is located at 256 N 1075 W, Clearfield, UT 84015 and is currently estimated at $523,882, approximately $155 per square foot. 256 N 1075 W is a home located in Davis County with nearby schools including Holt Elementary School, North Davis Junior High School, and Syracuse High School.
Ownership History
Date
Name
Owned For
Owner Type
Purchase Details
Closed on
Oct 10, 2012
Sold by
Smith Nathaniel T
Bought by
Smith Nathaniel and Smith Amy
Current Estimated Value
Home Financials for this Owner
Home Financials are based on the most recent Mortgage that was taken out on this home.
Original Mortgage
$179,000
Interest Rate
3.58%
Mortgage Type
New Conventional
Purchase Details
Closed on
Apr 30, 2009
Sold by
Gardner Bts Park Village Llc
Bought by
Smith Nathaniel T
Home Financials for this Owner
Home Financials are based on the most recent Mortgage that was taken out on this home.
Original Mortgage
$186,558
Interest Rate
4.8%
Mortgage Type
FHA
Create a Home Valuation Report for This Property
The Home Valuation Report is an in-depth analysis detailing your home's value as well as a comparison with similar homes in the area
Home Values in the Area
Average Home Value in this Area
Purchase History
| Date | Buyer | Sale Price | Title Company |
|---|---|---|---|
| Smith Nathaniel | -- | Absolute Title Ins A | |
| Smith Nathaniel T | -- | Backman Title Services |
Source: Public Records
Mortgage History
| Date | Status | Borrower | Loan Amount |
|---|---|---|---|
| Previous Owner | Smith Nathaniel | $179,000 | |
| Previous Owner | Smith Nathaniel T | $186,558 |
Source: Public Records
Tax History Compared to Growth
Tax History
| Year | Tax Paid | Tax Assessment Tax Assessment Total Assessment is a certain percentage of the fair market value that is determined by local assessors to be the total taxable value of land and additions on the property. | Land | Improvement |
|---|---|---|---|---|
| 2025 | -- | $261,250 | $58,258 | $202,992 |
| 2024 | -- | $256,850 | $55,766 | $201,084 |
| 2023 | $0 | $431,000 | $90,206 | $340,794 |
| 2022 | $2,134 | $259,050 | $52,695 | $206,355 |
| 2021 | $2,134 | $355,000 | $51,094 | $303,906 |
| 2020 | $2,134 | $322,000 | $44,338 | $277,662 |
| 2019 | $2,134 | $307,000 | $49,846 | $257,154 |
| 2018 | $0 | $283,000 | $42,031 | $240,969 |
| 2016 | $2,033 | $137,445 | $17,337 | $120,108 |
| 2015 | $1,831 | $118,030 | $17,337 | $100,693 |
| 2014 | $1,633 | $106,700 | $17,337 | $89,363 |
| 2013 | -- | $79,531 | $18,970 | $60,561 |
Source: Public Records
Map
Nearby Homes
- 303 N Canterbury Way
- 417 N 1200 W Unit 84
- 423 N 1250 W Unit 118
- 288 N 825 W
- Evergreen Plan at Ivie Meadows
- 274 N 825 W
- 16 N 1300 W
- 1337 W 550 N Unit 195
- 777 W 300 N
- 620 N 1100 W
- 762 W 300 N
- 575 N 1350 W Unit 137
- 563 N 1350 W Unit 139
- 1350 W 300 N Unit 49
- 1350 W 300 N Unit 38
- 1350 W 300 N Unit 29
- 232 N Rick Way
- 690 Barlow St
- 853 W 700 N
- 135 S 1525 W
- 262 N 1075 W
- 1054 W 250 N
- 268 N 1075 W
- 268 N 1075 W Unit 47
- 1080 W 250 N
- 1063 W 250 N
- 1073 W 250 N
- 1044 W 250 N
- 1053 W 250 N
- 1079 W 250 N
- 1088 W 250 N
- 1081 W 275 N
- 1081 W 275 N Unit 46
- 1043 W 250 N Unit 17
- 274 N 1075 W
- 274 N 1075 W Unit 48
- 1034 W 250 N
- 1085 W 250 N
- 1085 W 250 N Unit 22
- 1087 W 275 N Unit 45