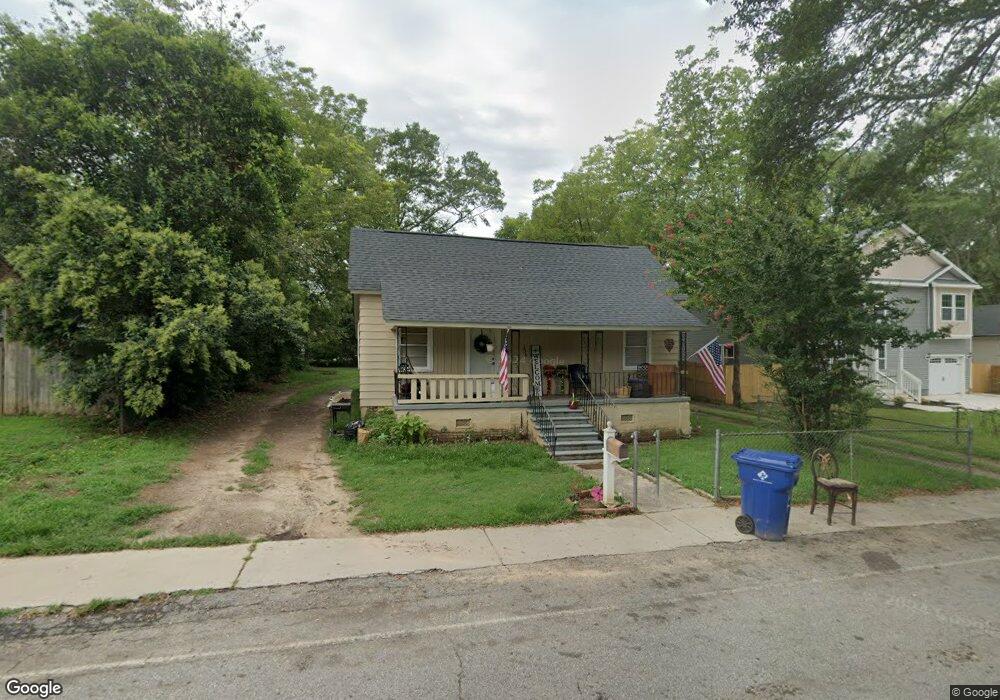
256 Poole St Woodruff, SC 29388
Estimated Value: $95,000 - $186,000
1
Bed
1
Bath
1,417
Sq Ft
$92/Sq Ft
Est. Value
About This Home
This home is located at 256 Poole St, Woodruff, SC 29388 and is currently estimated at $130,420, approximately $92 per square foot. 256 Poole St is a home located in Spartanburg County with nearby schools including Woodruff Primary School, Woodruff Elementary School, and Woodruff Middle School.
Ownership History
Date
Name
Owned For
Owner Type
Purchase Details
Closed on
Aug 3, 2017
Sold by
Allen Edward Jarvis
Bought by
Juarez Catalino and Juarez Elda
Current Estimated Value
Purchase Details
Closed on
Mar 8, 2013
Sold by
Eh Pooled 1211 Lp
Bought by
Allen Edward Jarvis
Purchase Details
Closed on
Dec 22, 2011
Sold by
Branch Banking & Trust Company
Bought by
Eh Pooled 1211 Lp
Purchase Details
Closed on
Oct 19, 2011
Sold by
Zithri Corporation
Bought by
Branch Banking & Trust Company
Purchase Details
Closed on
Feb 23, 2005
Sold by
Wilson Michael D
Bought by
Zithri Corp
Purchase Details
Closed on
Apr 12, 2004
Sold by
Citibank Na
Bought by
Wilson Michael D
Purchase Details
Closed on
Jan 13, 2004
Sold by
Burnett Lisa N
Bought by
Citibank Na
Purchase Details
Closed on
Jun 27, 2002
Sold by
Brown Billy Wayne and Brown Patsy H
Bought by
Burnett Lisa N
Create a Home Valuation Report for This Property
The Home Valuation Report is an in-depth analysis detailing your home's value as well as a comparison with similar homes in the area
Home Values in the Area
Average Home Value in this Area
Purchase History
| Date | Buyer | Sale Price | Title Company |
|---|---|---|---|
| Juarez Catalino | $28,000 | Hanover Totle Ag Inc | |
| Allen Edward Jarvis | $9,000 | -- | |
| Eh Pooled 1211 Lp | $9,000 | -- | |
| Branch Banking & Trust Company | $25,000 | -- | |
| Zithri Corp | -- | -- | |
| Wilson Michael D | $7,200 | -- | |
| Citibank Na | $22,950 | -- | |
| Burnett Lisa N | $27,675 | -- |
Source: Public Records
Tax History
| Year | Tax Paid | Tax Assessment Tax Assessment Total Assessment is a certain percentage of the fair market value that is determined by local assessors to be the total taxable value of land and additions on the property. | Land | Improvement |
|---|---|---|---|---|
| 2022 | $1,625 | $3,450 | $360 | $3,090 |
| 2021 | $1,631 | $3,450 | $360 | $3,090 |
| 2020 | $1,578 | $3,450 | $360 | $3,090 |
| 2019 | $1,578 | $3,450 | $360 | $3,090 |
| 2018 | $1,567 | $3,450 | $360 | $3,090 |
| 2017 | $1,367 | $2,952 | $360 | $2,592 |
| 2016 | $1,351 | $2,952 | $360 | $2,592 |
| 2015 | $1,342 | $2,952 | $360 | $2,592 |
| 2014 | $1,314 | $2,952 | $360 | $2,592 |
Source: Public Records
Map
Nearby Homes
- 307 Woodruff St
- 166 Buncombe St
- 182 Buncombe St
- 178 Buncombe St
- 174 Buncombe St
- 170 Buncombe St
- 183 Eastbrook Dr
- 162 Buncombe St
- 185 Eastbrook Dr
- 189 Eastbrook Dr
- 612 Buncombe St
- 193 Eastbrook Dr
- 197 Eastbrook Dr
- 179 Eastbrook Dr
- 547 Keller Ln
- 16 Poplar St
- 408 Bucky Dr
- 0 Poplar St
- 000000 Poplar St
- 00000 Poplar St
Your Personal Tour Guide
Ask me questions while you tour the home.