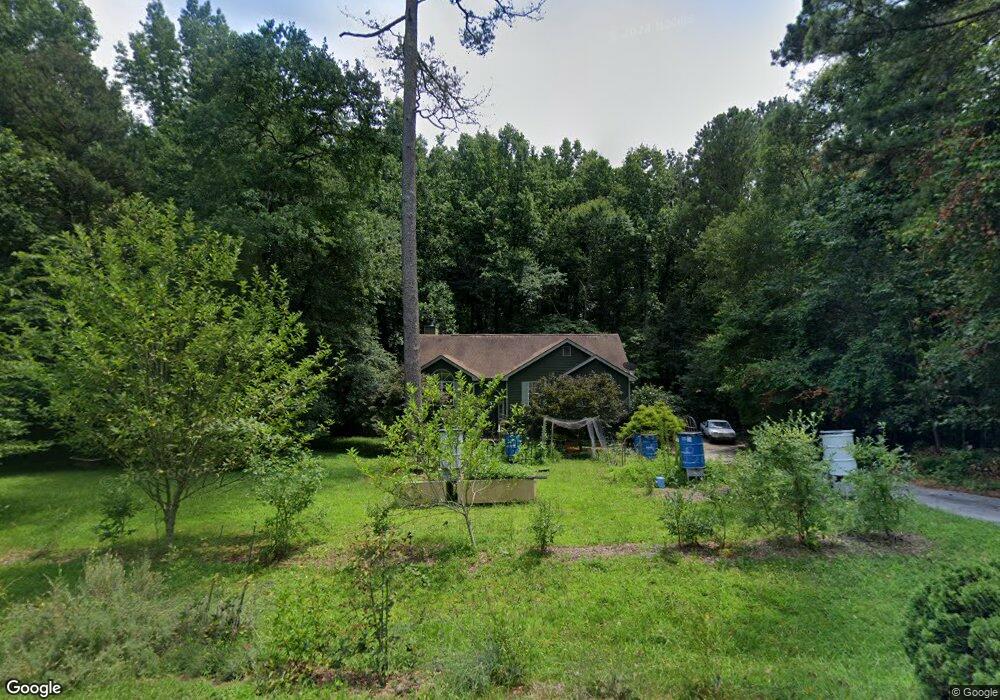
256 Poplar Springs Rd Hoschton, GA 30548
Estimated Value: $291,000 - $420,000
5
Beds
3
Baths
2,123
Sq Ft
$162/Sq Ft
Est. Value
About This Home
This home is located at 256 Poplar Springs Rd, Hoschton, GA 30548 and is currently estimated at $343,150, approximately $161 per square foot. 256 Poplar Springs Rd is a home located in Jackson County with nearby schools including West Jackson Elementary School, West Jackson Middle School, and Jackson County High School.
Ownership History
Date
Name
Owned For
Owner Type
Purchase Details
Closed on
Nov 24, 2009
Sold by
Fdic
Bought by
Bradshaw Roger
Current Estimated Value
Home Financials for this Owner
Home Financials are based on the most recent Mortgage that was taken out on this home.
Original Mortgage
$120,000
Outstanding Balance
$78,712
Interest Rate
5.01%
Mortgage Type
VA
Estimated Equity
$264,438
Purchase Details
Closed on
Sep 30, 2009
Sold by
Taylor Bean Whitaker
Bought by
Ib Property Holdings
Home Financials for this Owner
Home Financials are based on the most recent Mortgage that was taken out on this home.
Original Mortgage
$120,000
Outstanding Balance
$78,712
Interest Rate
5.01%
Mortgage Type
VA
Estimated Equity
$264,438
Purchase Details
Closed on
Dec 2, 2008
Sold by
West Graciela E
Bought by
Taylor Bean
Purchase Details
Closed on
Sep 20, 2002
Sold by
West Graciela E
Bought by
West Graciela E
Purchase Details
Closed on
Jul 9, 1998
Sold by
Green Courtney L and Green J
Bought by
West Graciela E
Create a Home Valuation Report for This Property
The Home Valuation Report is an in-depth analysis detailing your home's value as well as a comparison with similar homes in the area
Home Values in the Area
Average Home Value in this Area
Purchase History
| Date | Buyer | Sale Price | Title Company |
|---|---|---|---|
| Bradshaw Roger | $117,500 | -- | |
| Ib Property Holdings | -- | -- | |
| Taylor Bean | $147,643 | -- | |
| West Graciela E | -- | -- | |
| West Graciela E | $112,900 | -- |
Source: Public Records
Mortgage History
| Date | Status | Borrower | Loan Amount |
|---|---|---|---|
| Open | Bradshaw Roger | $120,000 |
Source: Public Records
Tax History Compared to Growth
Tax History
| Year | Tax Paid | Tax Assessment Tax Assessment Total Assessment is a certain percentage of the fair market value that is determined by local assessors to be the total taxable value of land and additions on the property. | Land | Improvement |
|---|---|---|---|---|
| 2024 | $2,191 | $86,360 | $16,000 | $70,360 |
| 2023 | $2,191 | $77,960 | $16,000 | $61,960 |
| 2022 | $1,591 | $56,520 | $8,000 | $48,520 |
| 2021 | $1,655 | $56,520 | $8,000 | $48,520 |
| 2020 | $1,507 | $47,040 | $8,000 | $39,040 |
| 2019 | $1,530 | $47,040 | $8,000 | $39,040 |
| 2018 | $1,483 | $45,040 | $8,000 | $37,040 |
| 2017 | $1,380 | $41,581 | $8,000 | $33,581 |
| 2016 | $1,388 | $41,581 | $8,000 | $33,581 |
| 2015 | $1,386 | $41,581 | $8,000 | $33,581 |
| 2014 | $1,019 | $30,523 | $8,000 | $22,523 |
| 2013 | -- | $30,522 | $8,000 | $22,522 |
Source: Public Records
Map
Nearby Homes
- 241 Bill Watkins Rd
- 96 Ryans Way
- 404 Shasta Ct
- 74 Indian Creek Way
- 45 Thedford Dr
- 96 Indian Creek Way
- The Langford Plan at Allen Manor
- The Harrington Plan at Allen Manor
- The James Plan at Allen Manor
- The Crawford Plan at Allen Manor
- The Caldwell Plan at Allen Manor
- The McGinnis Plan at Allen Manor
- 59 Thedford Dr
- 153 Cherokee Trail
- 32 Thedford Dr
- 3257 Traditions Way
- 3410 Traditions Way
- 226 Poplar Springs Rd
- 261 Poplar Springs Rd
- 229 Poplar Springs Rd
- 194 Poplar Springs Rd
- 325 Poplar Springs Rd
- 338 Poplar Springs Rd
- 0 Poplar Springs Rd Unit 7314254
- 0 Poplar Springs Rd Unit 7225066
- 0 Poplar Springs Rd Unit 7154028
- 0 Poplar Springs Rd Unit 8364471
- 0 Poplar Springs Rd Unit 8280586
- 0 Poplar Springs Rd Unit 8110352
- 0 Poplar Springs Rd Unit 8032699
- 0 Poplar Springs Rd Unit 7638467
- 0 Poplar Springs Rd Unit 3242165
- 0 Poplar Springs Rd Unit 8392681
- 0 Poplar Springs Rd Unit 8901891
- 0 Poplar Springs Rd Unit 3220302
- 191 Poplar Springs Rd
- 636 Marshall Clark Rd