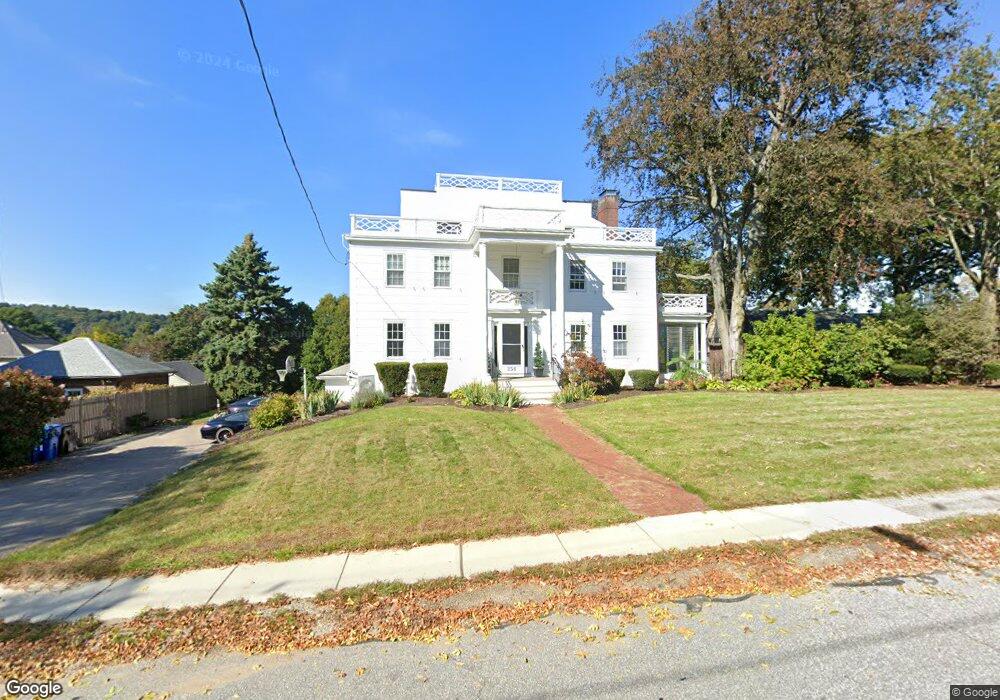
256 Slade St Belmont, MA 02478
Belmont Center NeighborhoodEstimated Value: $2,022,000 - $2,308,000
5
Beds
4
Baths
2,592
Sq Ft
$820/Sq Ft
Est. Value
About This Home
This home is located at 256 Slade St, Belmont, MA 02478 and is currently estimated at $2,125,507, approximately $820 per square foot. 256 Slade St is a home located in Middlesex County with nearby schools including Roger Wellington Elementary School, Winthrop L Chenery Middle School, and Belmont High School.
Ownership History
Date
Name
Owned For
Owner Type
Purchase Details
Closed on
Dec 31, 2004
Sold by
Mcevoy Elizabeth C and Mcevoy Stephen C
Bought by
Tang Kiim W and Tang Susan M
Current Estimated Value
Home Financials for this Owner
Home Financials are based on the most recent Mortgage that was taken out on this home.
Original Mortgage
$333,700
Outstanding Balance
$168,257
Interest Rate
5.73%
Mortgage Type
Purchase Money Mortgage
Estimated Equity
$1,957,250
Purchase Details
Closed on
Sep 17, 2002
Sold by
Hickey Richard L and Hickey Margaret C
Bought by
Mcevoy Stephen C and Mcevoy Elizabeth C
Home Financials for this Owner
Home Financials are based on the most recent Mortgage that was taken out on this home.
Original Mortgage
$300,000
Interest Rate
6.48%
Mortgage Type
Purchase Money Mortgage
Create a Home Valuation Report for This Property
The Home Valuation Report is an in-depth analysis detailing your home's value as well as a comparison with similar homes in the area
Home Values in the Area
Average Home Value in this Area
Purchase History
| Date | Buyer | Sale Price | Title Company |
|---|---|---|---|
| Tang Kiim W | $1,042,500 | -- | |
| Mcevoy Stephen C | $895,000 | -- |
Source: Public Records
Mortgage History
| Date | Status | Borrower | Loan Amount |
|---|---|---|---|
| Open | Tang Kiim W | $333,700 | |
| Previous Owner | Mcevoy Stephen C | $300,000 |
Source: Public Records
Tax History Compared to Growth
Tax History
| Year | Tax Paid | Tax Assessment Tax Assessment Total Assessment is a certain percentage of the fair market value that is determined by local assessors to be the total taxable value of land and additions on the property. | Land | Improvement |
|---|---|---|---|---|
| 2025 | $23,498 | $2,063,000 | $1,093,000 | $970,000 |
| 2024 | $22,039 | $2,087,000 | $1,362,000 | $725,000 |
| 2023 | $19,670 | $1,750,000 | $1,039,000 | $711,000 |
| 2022 | $18,646 | $1,613,000 | $951,000 | $662,000 |
| 2021 | $18,429 | $1,597,000 | $1,040,000 | $557,000 |
| 2020 | $17,941 | $1,631,000 | $1,109,000 | $522,000 |
| 2019 | $15,976 | $1,369,000 | $866,000 | $503,000 |
| 2018 | $14,616 | $1,203,000 | $700,000 | $503,000 |
| 2017 | $14,530 | $1,145,000 | $642,000 | $503,000 |
| 2016 | $14,344 | $1,142,000 | $642,000 | $500,000 |
| 2015 | $13,506 | $1,047,000 | $548,000 | $499,000 |
Source: Public Records
Map
Nearby Homes
- 263 Common St
- 69 Horace Rd
- 38 Myrtle St
- 1 Spinney Terrace
- 160 Waverley St
- 72-74 Flett Rd
- 59-61 Gilbert Rd
- 36 Madison St
- 33 Slade St Unit 1
- 55-57 Hawthorne St
- 66 Channing Rd
- 125 Trapelo Rd Unit 21
- 125 Trapelo Rd Unit 23
- 23 Centre Ave
- 2 Bartlett Ave Unit 1
- 105 Watson Rd
- 33 Wellington Ln
- 88 Bartlett Ave
- 748 Belmont St
- 48 Concord Ave