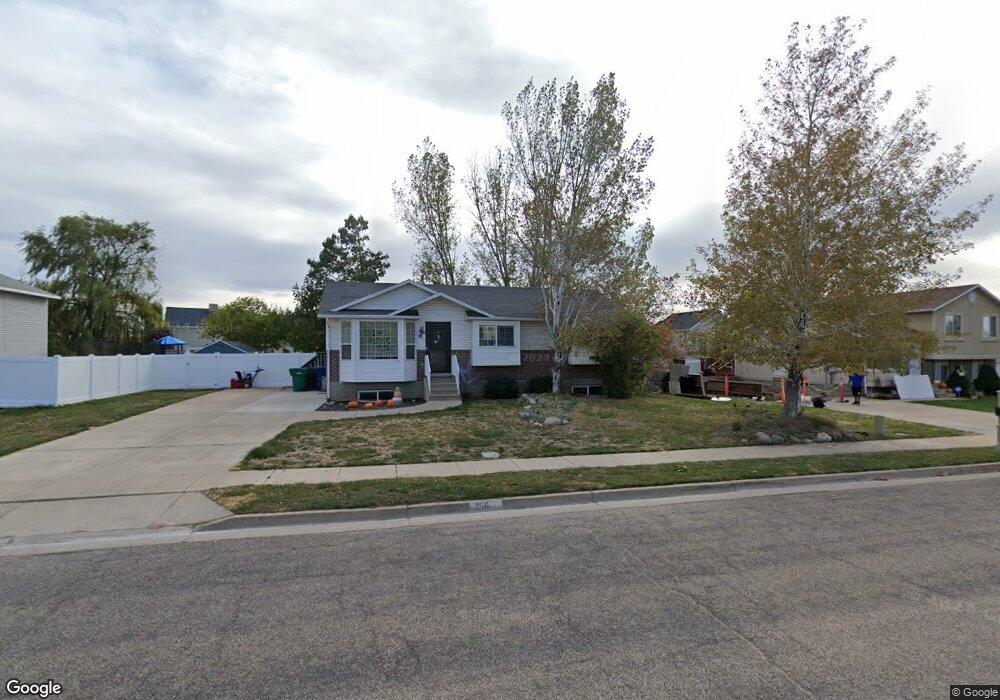
256 W 25 S Clearfield, UT 84015
Estimated Value: $427,000 - $528,000
5
Beds
2
Baths
2,096
Sq Ft
$220/Sq Ft
Est. Value
About This Home
This home is located at 256 W 25 S, Clearfield, UT 84015 and is currently estimated at $461,651, approximately $220 per square foot. 256 W 25 S is a home located in Davis County with nearby schools including Wasatch Elementary School, North Davis Junior High School, and Clearfield High School.
Ownership History
Date
Name
Owned For
Owner Type
Purchase Details
Closed on
Mar 8, 2021
Sold by
Lichfield Ronald C and Lichfield Ashlee H
Bought by
Lundstrom Lauren and Lundstrom Dale
Current Estimated Value
Home Financials for this Owner
Home Financials are based on the most recent Mortgage that was taken out on this home.
Original Mortgage
$370,500
Outstanding Balance
$331,372
Interest Rate
2.7%
Mortgage Type
New Conventional
Estimated Equity
$130,279
Purchase Details
Closed on
Nov 29, 2016
Sold by
Duke Partners Ii
Bought by
Lichfield Ronald C and Lichfield Ashlee H
Home Financials for this Owner
Home Financials are based on the most recent Mortgage that was taken out on this home.
Original Mortgage
$196,377
Interest Rate
3.87%
Mortgage Type
FHA
Purchase Details
Closed on
Sep 15, 2008
Sold by
Teeslink Kim J
Bought by
Teeslink Kimberly J
Home Financials for this Owner
Home Financials are based on the most recent Mortgage that was taken out on this home.
Original Mortgage
$159,671
Interest Rate
6.51%
Mortgage Type
FHA
Purchase Details
Closed on
Oct 30, 2007
Sold by
Tenderholt Kim J
Bought by
Teeslink Kim J
Home Financials for this Owner
Home Financials are based on the most recent Mortgage that was taken out on this home.
Original Mortgage
$146,160
Interest Rate
6.29%
Mortgage Type
FHA
Purchase Details
Closed on
Jul 21, 2005
Sold by
Alldredge David M and Alldredge Stephanie W
Bought by
Tenderholt Kim J
Home Financials for this Owner
Home Financials are based on the most recent Mortgage that was taken out on this home.
Original Mortgage
$106,400
Interest Rate
6.5%
Mortgage Type
Fannie Mae Freddie Mac
Purchase Details
Closed on
Dec 4, 1997
Sold by
Alldredge David M and Alldredge Stephanie W
Bought by
Alldredge David M and Alldredge Stephanie W
Home Financials for this Owner
Home Financials are based on the most recent Mortgage that was taken out on this home.
Original Mortgage
$95,808
Interest Rate
7.31%
Mortgage Type
FHA
Create a Home Valuation Report for This Property
The Home Valuation Report is an in-depth analysis detailing your home's value as well as a comparison with similar homes in the area
Home Values in the Area
Average Home Value in this Area
Purchase History
| Date | Buyer | Sale Price | Title Company |
|---|---|---|---|
| Lundstrom Lauren | -- | Gateway Title Insurance Age | |
| Lichfield Ronald C | -- | Security Title | |
| Teeslink Kimberly J | -- | Backman Title Services | |
| Teeslink Kim J | -- | Heritage West Title Ins Agen | |
| Tenderholt Kim J | -- | Equity Title Ins Agency Inc | |
| Alldredge David M | -- | Bonneville Title Company Inc | |
| Alldredge David M | -- | Bonneville Title Company Inc |
Source: Public Records
Mortgage History
| Date | Status | Borrower | Loan Amount |
|---|---|---|---|
| Open | Lundstrom Lauren | $370,500 | |
| Previous Owner | Lichfield Ronald C | $196,377 | |
| Previous Owner | Teeslink Kimberly J | $159,671 | |
| Previous Owner | Teeslink Kim J | $146,160 | |
| Previous Owner | Tenderholt Kim J | $106,400 | |
| Previous Owner | Alldredge David M | $95,808 |
Source: Public Records
Tax History Compared to Growth
Tax History
| Year | Tax Paid | Tax Assessment Tax Assessment Total Assessment is a certain percentage of the fair market value that is determined by local assessors to be the total taxable value of land and additions on the property. | Land | Improvement |
|---|---|---|---|---|
| 2025 | $2,357 | $211,200 | $75,188 | $136,012 |
| 2024 | $2,267 | $204,600 | $71,862 | $132,738 |
| 2023 | $2,119 | $351,000 | $114,709 | $236,291 |
| 2022 | $2,473 | $221,650 | $65,418 | $156,232 |
| 2021 | $2,245 | $304,000 | $71,012 | $232,988 |
| 2020 | $1,949 | $262,000 | $59,995 | $202,005 |
| 2019 | $1,883 | $250,000 | $61,869 | $188,131 |
| 2018 | $1,694 | $219,000 | $54,915 | $164,085 |
| 2016 | $1,333 | $90,145 | $22,033 | $68,112 |
| 2015 | $1,256 | $80,960 | $22,033 | $58,927 |
| 2014 | $1,123 | $73,372 | $22,033 | $51,339 |
| 2013 | -- | $72,186 | $31,113 | $41,073 |
Source: Public Records
Map
Nearby Homes
- 53 S 150 W
- 265 W 125 N
- 75 W 250 N Unit 93
- 75 W 250 N Unit 84
- 75 W 250 N Unit 110
- 75 W 250 N Unit 37
- 75 W 250 N Unit 105
- 91 N 500 W
- 158 S Bushnell Way
- 137 W 250 N
- 111 Center St Unit 6A
- 111 Center St Unit 3B
- 168 N 500 W
- 54 W 250 N
- 482 W 275 N
- 228 N 500 W
- 121 S Lakeview Dr
- 169 W 400 N
- 180 W 400 N
- 230 S Lakeview Dr