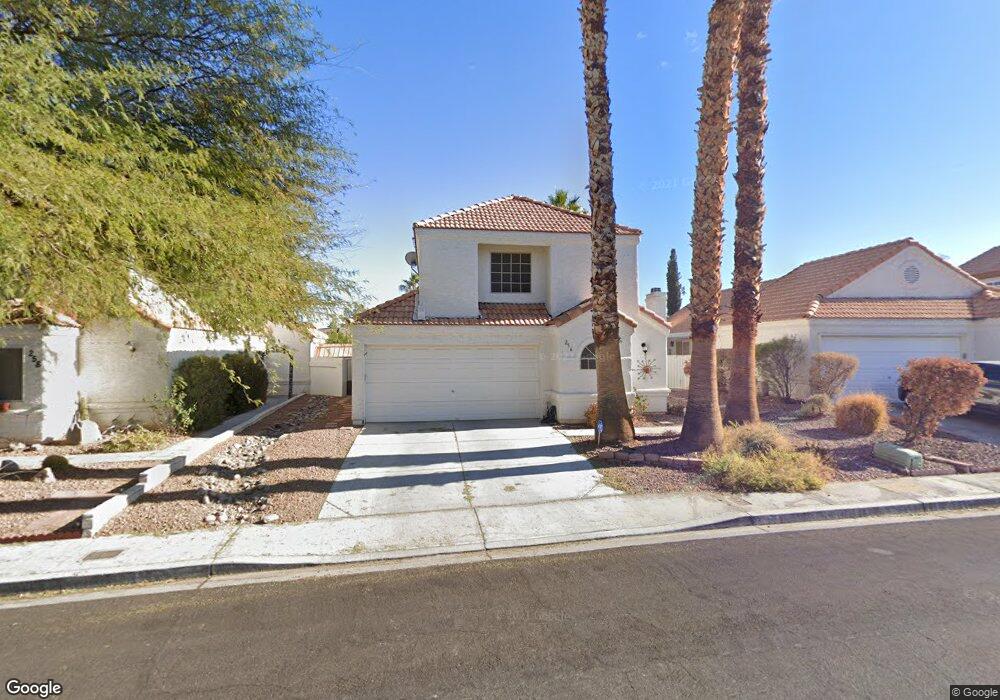
256 Westwind Rd Unit 1 Henderson, NV 89074
Green Valley North NeighborhoodEstimated Value: $419,432 - $452,000
3
Beds
2
Baths
1,615
Sq Ft
$268/Sq Ft
Est. Value
About This Home
This home is located at 256 Westwind Rd Unit 1, Henderson, NV 89074 and is currently estimated at $433,358, approximately $268 per square foot. 256 Westwind Rd Unit 1 is a home located in Clark County with nearby schools including James Gibson Elementary School, Barbara and Hank Greenspun Junior High School, and Green Valley High School.
Ownership History
Date
Name
Owned For
Owner Type
Purchase Details
Closed on
Jan 8, 2025
Sold by
Rhymer Cheryl L
Bought by
Clr Family Trust
Current Estimated Value
Purchase Details
Closed on
Nov 10, 2004
Sold by
Williams Emba
Bought by
Williams Emba and Rhymer Cheryl L
Purchase Details
Closed on
Jul 26, 2001
Sold by
Kramer Lawrence and Kramer Jessie A
Bought by
Williams Emba
Home Financials for this Owner
Home Financials are based on the most recent Mortgage that was taken out on this home.
Original Mortgage
$121,200
Interest Rate
7.21%
Purchase Details
Closed on
Jun 5, 1997
Sold by
Kramer Jessie A and Kramer Lawrence
Bought by
Kramer Lawrence and Kramer Jessie A
Home Financials for this Owner
Home Financials are based on the most recent Mortgage that was taken out on this home.
Original Mortgage
$100,800
Interest Rate
7.98%
Create a Home Valuation Report for This Property
The Home Valuation Report is an in-depth analysis detailing your home's value as well as a comparison with similar homes in the area
Home Values in the Area
Average Home Value in this Area
Purchase History
| Date | Buyer | Sale Price | Title Company |
|---|---|---|---|
| Clr Family Trust | -- | None Listed On Document | |
| Clr Family Trust | -- | None Listed On Document | |
| Williams Emba | -- | -- | |
| Williams Emba | $151,500 | Stewart Title | |
| Kramer Lawrence | -- | Nevada Title Company |
Source: Public Records
Mortgage History
| Date | Status | Borrower | Loan Amount |
|---|---|---|---|
| Previous Owner | Williams Emba | $121,200 | |
| Previous Owner | Kramer Lawrence | $100,800 |
Source: Public Records
Tax History Compared to Growth
Tax History
| Year | Tax Paid | Tax Assessment Tax Assessment Total Assessment is a certain percentage of the fair market value that is determined by local assessors to be the total taxable value of land and additions on the property. | Land | Improvement |
|---|---|---|---|---|
| 2025 | $1,431 | $78,357 | $35,000 | $43,357 |
| 2024 | $1,390 | $78,357 | $35,000 | $43,357 |
| 2023 | $1,390 | $76,023 | $34,125 | $41,898 |
| 2022 | $1,350 | $66,438 | $27,825 | $38,613 |
| 2021 | $1,310 | $61,560 | $24,500 | $37,060 |
| 2020 | $1,269 | $60,809 | $23,800 | $37,009 |
| 2019 | $1,232 | $58,059 | $21,350 | $36,709 |
| 2018 | $1,196 | $54,002 | $18,550 | $35,452 |
| 2017 | $1,586 | $54,712 | $18,550 | $36,162 |
| 2016 | $1,134 | $49,543 | $12,950 | $36,593 |
| 2015 | $1,131 | $46,820 | $10,500 | $36,320 |
| 2014 | $1,096 | $41,913 | $8,750 | $33,163 |
Source: Public Records
Map
Nearby Homes
- 272 Grand Teton Dr
- 259 Spring Hills Ln
- 2108 Running River Rd
- 1939 Guinn Dr
- 231 Windsong Dr
- 346 Pinnacle Ct
- 371 Legacy Dr
- 1926 Navarre Ln
- 2246 Cassatt Dr
- 1952 Barranca Dr
- 2250 Cassatt Dr
- 372 Rushing Creek Ct
- 347 Gana Ct Unit B
- 310 Pissarro Place
- 2251 Van Gogh Dr
- 2021 Angel Falls Dr
- 2239 Chatsworth Ct
- 322 Oliveiro Ct
- 1832 Muchacha Dr
- 1831 Escondido Terrace
- 254 Westwind Rd
- 258 Westwind Rd Unit 1
- 252 Westwind Rd
- 260 Westwind Rd
- 2009 Big Bend Way
- 2011 Big Bend Way
- 262 Westwind Rd
- 2013 Big Bend Way
- 257 Westwind Rd
- 2007 Big Bend Way
- 250 Westwind Rd
- 259 Westwind Rd
- 255 Westwind Rd
- 2005 Yosemite Ct
- 2015 Big Bend Way
- 264 Westwind Rd
- 261 Westwind Rd
- 2101 Sun Swept Way
- 263 Westwind Rd
- 2007 Yosemite Ct