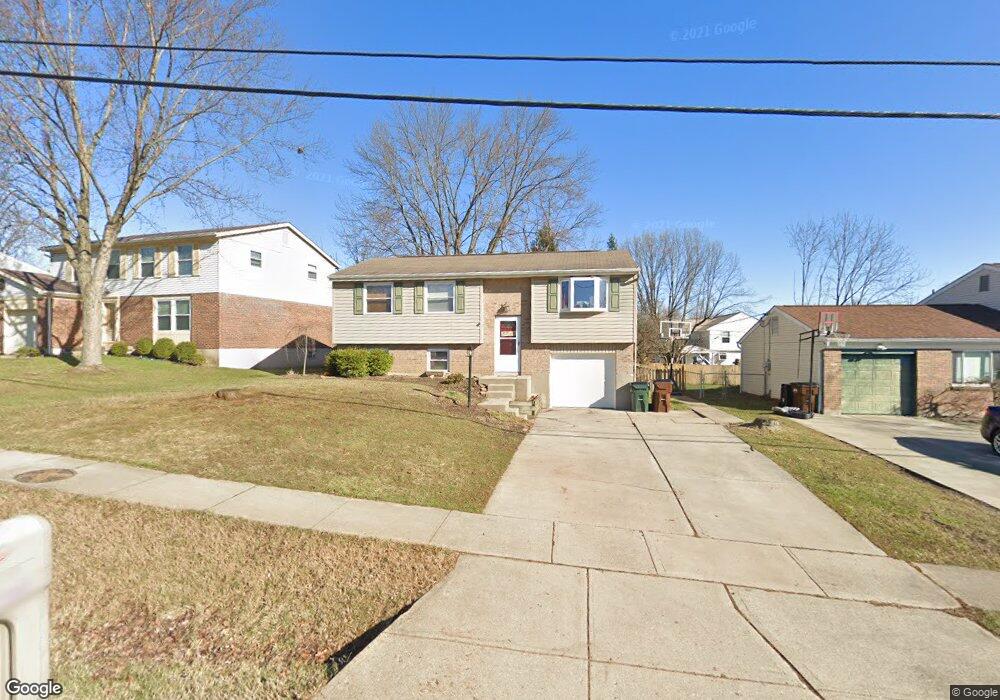
2560 Crest Rd Cincinnati, OH 45231
Pleasant Run NeighborhoodEstimated Value: $245,767 - $272,000
3
Beds
2
Baths
1,670
Sq Ft
$155/Sq Ft
Est. Value
About This Home
This home is located at 2560 Crest Rd, Cincinnati, OH 45231 and is currently estimated at $258,692, approximately $154 per square foot. 2560 Crest Rd is a home located in Hamilton County with nearby schools including Pleasant Run Elementary School, Pleasant Run Middle School, and Northwest High School.
Ownership History
Date
Name
Owned For
Owner Type
Purchase Details
Closed on
Feb 19, 2021
Sold by
Getty Janet R
Bought by
Lindquist Nadine E
Current Estimated Value
Purchase Details
Closed on
Oct 29, 2002
Sold by
Getty Douglass and Getty Janet
Bought by
Lindquist Nadine E and Lindquist David N
Home Financials for this Owner
Home Financials are based on the most recent Mortgage that was taken out on this home.
Original Mortgage
$120,000
Interest Rate
4.4%
Mortgage Type
Seller Take Back
Purchase Details
Closed on
Aug 21, 2002
Sold by
Gundy Julie M and Gundy Robert E
Bought by
Getty Douglas and Getty Janet
Purchase Details
Closed on
Aug 31, 1994
Sold by
Cross Joyce K
Bought by
Bruner Julie
Home Financials for this Owner
Home Financials are based on the most recent Mortgage that was taken out on this home.
Original Mortgage
$81,442
Interest Rate
8.65%
Mortgage Type
FHA
Create a Home Valuation Report for This Property
The Home Valuation Report is an in-depth analysis detailing your home's value as well as a comparison with similar homes in the area
Home Values in the Area
Average Home Value in this Area
Purchase History
We collect this data history from publicly available records. To have your information removed, we recommend requesting removal directly through your county’s website.
| Date | Buyer | Sale Price | Title Company |
|---|---|---|---|
| Lindquist Nadine E | -- | None Available | |
| Lindquist Nadine E | $120,000 | -- | |
| Getty Douglas | $120,000 | -- | |
| Bruner Julie | -- | -- |
Source: Public Records
Mortgage History
We collect this data history from publicly available records. To have your information removed, we recommend requesting removal directly through your county’s website.
| Date | Status | Borrower | Loan Amount |
|---|---|---|---|
| Previous Owner | Lindquist Nadine E | $120,000 | |
| Previous Owner | Bruner Julie | $81,442 |
Source: Public Records
Tax History
| Year | Tax Paid | Tax Assessment Tax Assessment Total Assessment is a certain percentage of the fair market value that is determined by local assessors to be the total taxable value of land and additions on the property. | Land | Improvement |
|---|---|---|---|---|
| 2025 | $3,787 | $65,667 | $8,442 | $57,225 |
| 2023 | $3,532 | $65,667 | $8,442 | $57,225 |
| 2022 | $3,158 | $47,877 | $6,941 | $40,936 |
| 2021 | $3,287 | $47,877 | $6,941 | $40,936 |
| 2020 | $3,248 | $47,877 | $6,941 | $40,936 |
| 2019 | $2,823 | $38,609 | $5,597 | $33,012 |
| 2018 | $2,540 | $38,609 | $5,597 | $33,012 |
| 2017 | $2,441 | $38,609 | $5,597 | $33,012 |
| 2016 | $2,066 | $31,868 | $6,976 | $24,892 |
| 2015 | $2,057 | $31,868 | $6,976 | $24,892 |
| 2014 | $2,063 | $31,868 | $6,976 | $24,892 |
| 2013 | $2,069 | $33,544 | $7,343 | $26,201 |
Source: Public Records
Map
Nearby Homes
- 2465 Owlcrest Dr
- 11717 Hamilton Ave
- 11471 Ravensburg Ct
- 2456 Houston Rd
- 2484 Houston Rd
- 2484 Houston Rd Unit 8
- 2486 Houston Rd
- 2486 Houston Rd Unit 7
- 11424 Riga Ct
- 3030 Crest Rd
- 11518 Raphael Place
- 11287 Templeton Dr
- 11261 Melissa Ct
- 11992 Pippin Rd
- 11384 Melissa Ct
- 2611 Retford Dr
- 11995 Wincanton Dr
- 12013 Westland Ct
- 12060 Regency Run Ct
- 12080 Regency Run Ct Unit 4
- 2578 Crest Rd
- 2548 Crest Rd
- 2592 Crest Rd
- 2536 Crest Rd
- 2549 Hazelcrest Ln
- 2555 Hazelcrest Ln
- 2541 Hazelcrest Ln
- 2533 Hazelcrest Ln
- 2559 Crest Rd
- 2563 Hazelcrest Ln
- 2522 Crest Rd
- 2606 Crest Rd
- 2575 Crest Rd
- 2547 Crest Rd
- 2589 Crest Rd
- 2535 Crest Rd
- 2527 Hazelcrest Ln
- 2597 Crest Rd
- 2571 Hazelcrest Ln
- 2510 Crest Rd
Your Personal Tour Guide
Ask me questions while you tour the home.