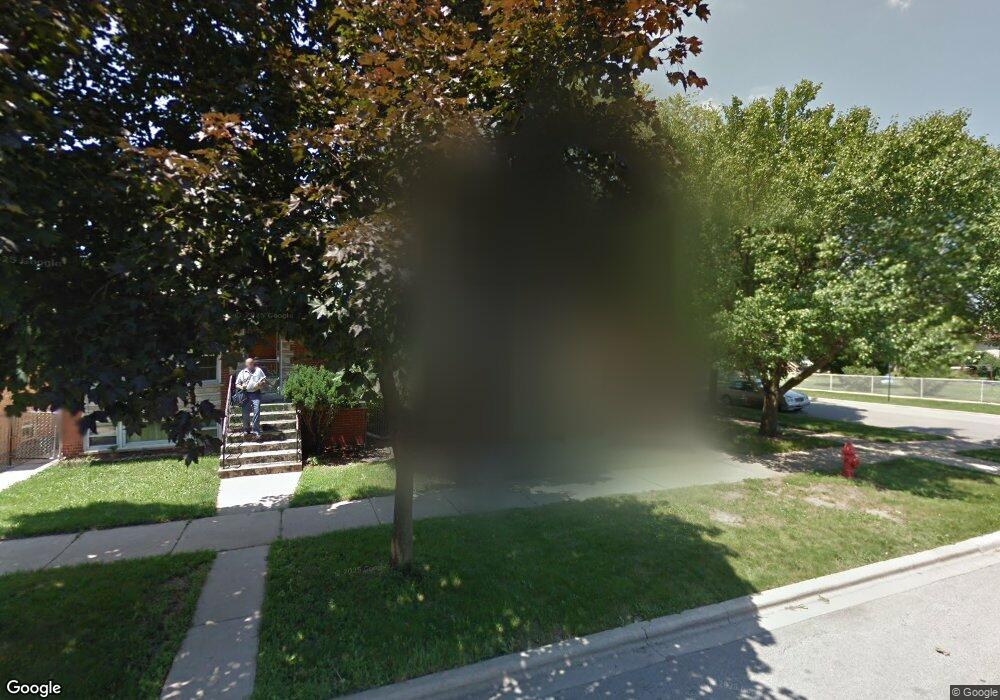
2560 Hessing St River Grove, IL 60171
Estimated Value: $370,000 - $497,000
4
Beds
2
Baths
2,386
Sq Ft
$179/Sq Ft
Est. Value
About This Home
This home is located at 2560 Hessing St, River Grove, IL 60171 and is currently estimated at $426,033, approximately $178 per square foot. 2560 Hessing St is a home located in Cook County with nearby schools including River Grove School and St. Francis Borgia School.
Ownership History
Date
Name
Owned For
Owner Type
Purchase Details
Closed on
Jun 20, 2001
Sold by
Krickl David G and Boucher Krickl Celeste
Bought by
Allen Michael E and Keenan Allen Jennifer
Current Estimated Value
Home Financials for this Owner
Home Financials are based on the most recent Mortgage that was taken out on this home.
Original Mortgage
$106,650
Outstanding Balance
$40,536
Interest Rate
7.11%
Estimated Equity
$385,497
Purchase Details
Closed on
Oct 21, 1998
Sold by
Nelson Kenneth H and Nelson Kathleen A
Bought by
Krickl David G and Boucher Krickl Celeste
Home Financials for this Owner
Home Financials are based on the most recent Mortgage that was taken out on this home.
Original Mortgage
$186,650
Interest Rate
6.78%
Purchase Details
Closed on
Nov 28, 1994
Sold by
Accomando Michael J and Accomando Lorraine M
Bought by
Nelson Kenneth H and Nelson Kathleen A
Home Financials for this Owner
Home Financials are based on the most recent Mortgage that was taken out on this home.
Original Mortgage
$180,500
Interest Rate
8.25%
Create a Home Valuation Report for This Property
The Home Valuation Report is an in-depth analysis detailing your home's value as well as a comparison with similar homes in the area
Home Values in the Area
Average Home Value in this Area
Purchase History
| Date | Buyer | Sale Price | Title Company |
|---|---|---|---|
| Allen Michael E | $235,000 | -- | |
| Krickl David G | $196,500 | -- | |
| Nelson Kenneth H | $190,000 | -- |
Source: Public Records
Mortgage History
| Date | Status | Borrower | Loan Amount |
|---|---|---|---|
| Open | Allen Michael E | $106,650 | |
| Previous Owner | Krickl David G | $186,650 | |
| Previous Owner | Nelson Kenneth H | $180,500 |
Source: Public Records
Tax History Compared to Growth
Tax History
| Year | Tax Paid | Tax Assessment Tax Assessment Total Assessment is a certain percentage of the fair market value that is determined by local assessors to be the total taxable value of land and additions on the property. | Land | Improvement |
|---|---|---|---|---|
| 2024 | $6,976 | $25,257 | $5,512 | $19,745 |
| 2023 | $8,743 | $25,257 | $5,512 | $19,745 |
| 2022 | $8,743 | $31,371 | $5,512 | $25,859 |
| 2021 | $8,483 | $25,892 | $3,936 | $21,956 |
| 2020 | $8,140 | $25,892 | $3,936 | $21,956 |
| 2019 | $8,118 | $29,323 | $3,936 | $25,387 |
| 2018 | $7,217 | $24,241 | $3,411 | $20,830 |
| 2017 | $7,151 | $24,241 | $3,411 | $20,830 |
| 2016 | $6,600 | $24,241 | $3,411 | $20,830 |
| 2015 | $5,878 | $20,793 | $3,018 | $17,775 |
| 2014 | $5,840 | $20,793 | $3,018 | $17,775 |
| 2013 | $6,227 | $22,881 | $3,018 | $19,863 |
Source: Public Records
Map
Nearby Homes
- 2617 Budd St
- 8250 W Grand Ave
- 2542 Budd St
- 2561 Marwood St
- 2524 Budd St
- 2501 Budd St
- 2726 Budd St
- 2504 Budd St
- 2521 N Thatcher Ave Unit 2i
- 2521 N Thatcher Ave Unit 3A
- 2414 N Haymond St
- 2533 Wood St
- 8460 River Grove Ave
- 2523 N East Brook Rd
- 7917 W Westwood Dr
- 7916 W Altgeld St
- 2424 Wood St
- 7849 W Westwood Dr
- 2443 Maple St
- 8522 Center St
- 2558 Hessing St
- 2556 Hessing St
- 2554 Hessing St
- 2552 Hessing St
- 2600 Hessing St
- 8255 Wrightwood Ave
- 2555 Budd St
- 2546 Hessing St
- 2608 Hessing St
- 2553 Budd St
- 2601 Budd St
- 2544 Hessing St
- 2610 Hessing St
- 2610 Hessing St Unit 2
- 2610 Hessing St Unit 1
- 2603 Budd St
- 8225 Wrightwood Ave
- 2561 Hessing St
- 2559 Hessing St
- 2549 Budd St