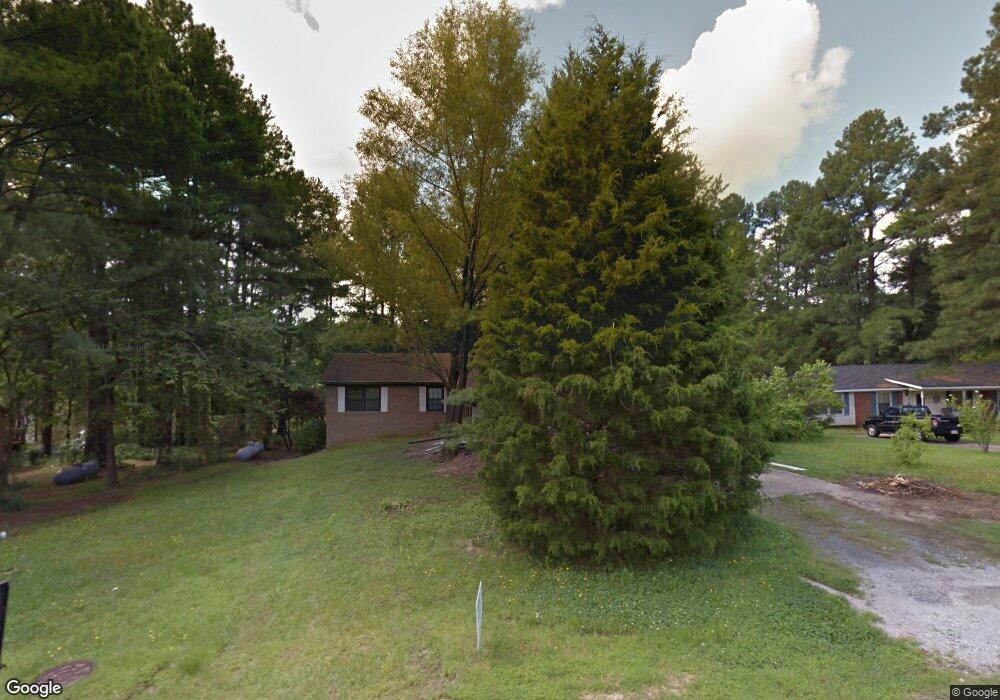
2560 Mangum Ave Creedmoor, NC 27522
Estimated Value: $306,000 - $324,000
4
Beds
3
Baths
2,622
Sq Ft
$120/Sq Ft
Est. Value
About This Home
This home is located at 2560 Mangum Ave, Creedmoor, NC 27522 and is currently estimated at $315,900, approximately $120 per square foot. 2560 Mangum Ave is a home located in Granville County with nearby schools including Mount Energy Elementary School, G.C. Hawley Middle School, and South Granville High School.
Ownership History
Date
Name
Owned For
Owner Type
Purchase Details
Closed on
Apr 12, 2018
Sold by
Andrews George William
Bought by
Andrews Shana
Current Estimated Value
Purchase Details
Closed on
Jun 1, 2013
Sold by
Jk and Shabarka
Bought by
Andrews George and Andrews Shana
Home Financials for this Owner
Home Financials are based on the most recent Mortgage that was taken out on this home.
Original Mortgage
$127,645
Outstanding Balance
$90,312
Interest Rate
3.37%
Mortgage Type
FHA
Estimated Equity
$225,588
Purchase Details
Closed on
Dec 21, 2012
Sold by
Federal National Mortagge Assn
Bought by
Jk & Shabar Llc
Purchase Details
Closed on
Apr 24, 2012
Sold by
Farmer Joseph G and Porterfield Janie D
Bought by
Federal National Mortgage Association and Fannie Mae
Create a Home Valuation Report for This Property
The Home Valuation Report is an in-depth analysis detailing your home's value as well as a comparison with similar homes in the area
Home Values in the Area
Average Home Value in this Area
Purchase History
| Date | Buyer | Sale Price | Title Company |
|---|---|---|---|
| Andrews Shana | -- | None Available | |
| Andrews George | $130,000 | None Available | |
| Jk & Shabar Llc | -- | None Available | |
| Federal National Mortgage Association | $199,495 | None Available | |
| Federal National Mortgage Association | -- | None Available |
Source: Public Records
Mortgage History
| Date | Status | Borrower | Loan Amount |
|---|---|---|---|
| Open | Andrews George | $127,645 |
Source: Public Records
Tax History Compared to Growth
Tax History
| Year | Tax Paid | Tax Assessment Tax Assessment Total Assessment is a certain percentage of the fair market value that is determined by local assessors to be the total taxable value of land and additions on the property. | Land | Improvement |
|---|---|---|---|---|
| 2025 | $1,272 | $175,381 | $37,000 | $138,381 |
| 2024 | $1,272 | $175,381 | $37,000 | $138,381 |
| 2023 | $1,264 | $119,191 | $27,500 | $91,691 |
| 2022 | $1,116 | $119,191 | $27,500 | $91,691 |
| 2021 | $1,039 | $119,191 | $27,500 | $91,691 |
| 2020 | $1,039 | $119,191 | $27,500 | $91,691 |
| 2019 | $1,029 | $117,976 | $27,500 | $90,476 |
| 2018 | $1,029 | $117,976 | $27,500 | $90,476 |
| 2016 | $1,121 | $123,084 | $27,500 | $95,584 |
| 2015 | $1,055 | $123,084 | $27,500 | $95,584 |
| 2014 | $1,121 | $123,084 | $27,500 | $95,584 |
| 2013 | -- | $123,084 | $27,500 | $95,584 |
Source: Public Records
Map
Nearby Homes
- 2063 Knight St
- 2661 Bowden Dr
- 2651 Bowden Dr
- 2639 Bowden Dr
- 2561 Mint Julep Dr
- 2571 Primrose Ln
- 2763 Garland Ct
- 2755 Dorothy Ct
- 2634 Bowden Dr
- 2726 Spring Valley Dr
- 2771 Clifton Ave
- 2134 Westbourne Dr
- 2019 Harrison Ct
- 1991 Ferbow St
- 1976 Ferbow St
- 2003 Zbonack Ct
- 709 Conifer Ct
- 0 Bennett Rd
- Division of 2644 Bennett Rd
- 21.04 Bennett Rd
- 2556 Mangum Ave
- 2562 Mangum Ave
- 2464 Mangum Ave
- LOT 29 Mangum Ave
- 2564 Mangum Ave
- 2464 Mangum Ave Unit 2555 A Capitol Drive
- 2554 Mangum Ave
- 2062 Knight St
- 2723 Spring Valley Dr
- 2729 Spring Valley Dr
- 7 Knight St
- 6 Knight St
- 0 Knight St
- 12 Knight St
- 8 Knight St
- Lot 3 Knight St
- 2064 Knight St
- 2065 Knight St
- 2563 Mangum Ave
- 2066 Knight St