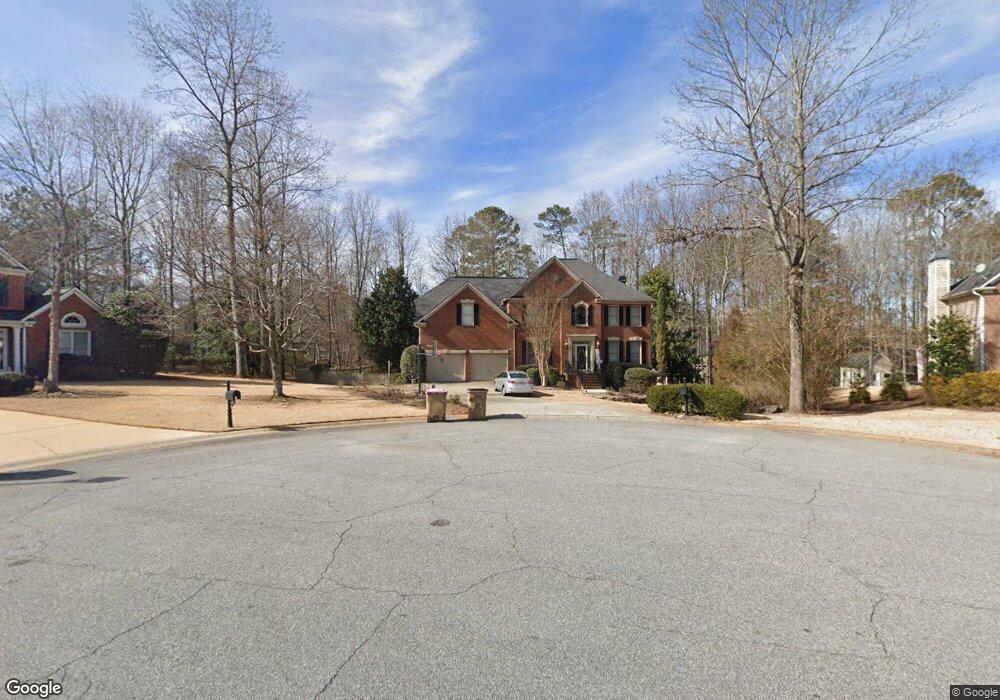
2560 New College Way Cumming, GA 30041
Estimated Value: $650,102 - $758,000
5
Beds
3
Baths
3,121
Sq Ft
$223/Sq Ft
Est. Value
About This Home
This home is located at 2560 New College Way, Cumming, GA 30041 and is currently estimated at $697,276, approximately $223 per square foot. 2560 New College Way is a home located in Forsyth County with nearby schools including Haw Creek Elementary School, Lakeside Middle School, and South Forsyth High School.
Ownership History
Date
Name
Owned For
Owner Type
Purchase Details
Closed on
Mar 18, 2022
Sold by
Margelli Christopher E
Bought by
Acmarge Llc
Current Estimated Value
Purchase Details
Closed on
Apr 29, 2002
Sold by
Corry Colin C and Corry Caroline M
Bought by
Margelli Christopher E and Margelli Alison B
Home Financials for this Owner
Home Financials are based on the most recent Mortgage that was taken out on this home.
Original Mortgage
$200,000
Interest Rate
7.18%
Mortgage Type
New Conventional
Purchase Details
Closed on
Feb 25, 1998
Sold by
Traton Corp Of Gwinnett Inc
Bought by
Corry Colin B
Home Financials for this Owner
Home Financials are based on the most recent Mortgage that was taken out on this home.
Original Mortgage
$164,500
Interest Rate
6.95%
Mortgage Type
New Conventional
Create a Home Valuation Report for This Property
The Home Valuation Report is an in-depth analysis detailing your home's value as well as a comparison with similar homes in the area
Home Values in the Area
Average Home Value in this Area
Purchase History
| Date | Buyer | Sale Price | Title Company |
|---|---|---|---|
| Acmarge Llc | -- | None Listed On Document | |
| Margelli Christopher E | $276,000 | -- | |
| Corry Colin B | $217,700 | -- |
Source: Public Records
Mortgage History
| Date | Status | Borrower | Loan Amount |
|---|---|---|---|
| Previous Owner | Margelli Christopher E | $200,000 | |
| Previous Owner | Corry Colin B | $164,500 |
Source: Public Records
Tax History Compared to Growth
Tax History
| Year | Tax Paid | Tax Assessment Tax Assessment Total Assessment is a certain percentage of the fair market value that is determined by local assessors to be the total taxable value of land and additions on the property. | Land | Improvement |
|---|---|---|---|---|
| 2025 | $6,236 | $251,784 | $72,000 | $179,784 |
| 2024 | $6,236 | $254,316 | $60,000 | $194,316 |
| 2023 | $5,810 | $236,048 | $60,000 | $176,048 |
| 2022 | $5,194 | $161,612 | $36,000 | $125,612 |
| 2021 | $3,970 | $161,612 | $36,000 | $125,612 |
| 2020 | $3,828 | $154,744 | $36,000 | $118,744 |
| 2019 | $3,732 | $149,796 | $32,000 | $117,796 |
| 2018 | $3,675 | $146,208 | $28,000 | $118,208 |
| 2017 | $3,397 | $132,352 | $28,000 | $104,352 |
| 2016 | $3,355 | $130,352 | $26,000 | $104,352 |
| 2015 | $3,214 | $123,392 | $24,000 | $99,392 |
| 2014 | -- | $111,648 | $24,000 | $87,648 |
Source: Public Records
Map
Nearby Homes
- 2580 New College Way
- 2755 Rustic Lake Terrace
- 2875 New College Way
- 2465 Churchill Downs
- 4015 Eyrie Farms Ln
- 4025 Eyrie Farms Ln
- 2515 Churchill Downs
- 2805 Cambria Ct
- 2530 Vistoria Dr
- 2935 Cobblestone Dr
- 3875 Sweetwater Dr
- 2115 Vistoria Dr
- 3435 Summit Trail
- 3620 Highpoint Rd
- 4050 Samples Rd
- 2850 Roanoke Rd
- 4135 Creekwood Dr
- 2470 Cambridge Hills Rd
- 2540 Marsha Cir
- 3500 Alexander Cir
- 2570 New College Way
- 2550 New College Way
- 2585 New College Way
- 2555 New College Way
- 2555 New College Way Unit 77
- 2575 New College Way
- 2675 New College Way
- 2565 New College Way
- 2680 Princeton Trace
- 2670 Princeton Trace
- 4135 Inverness Point
- 2685 New College Way
- 4130 Inverness Point
- 2590 New College Way
- 3950 Summerwood Dr
- 3945 Summerwood Dr
- 3965 Summerwood Dr
- 3955 Summerwood Dr
- 4165 Rolling Hills Dr
- 2630 New Rutgers Walk