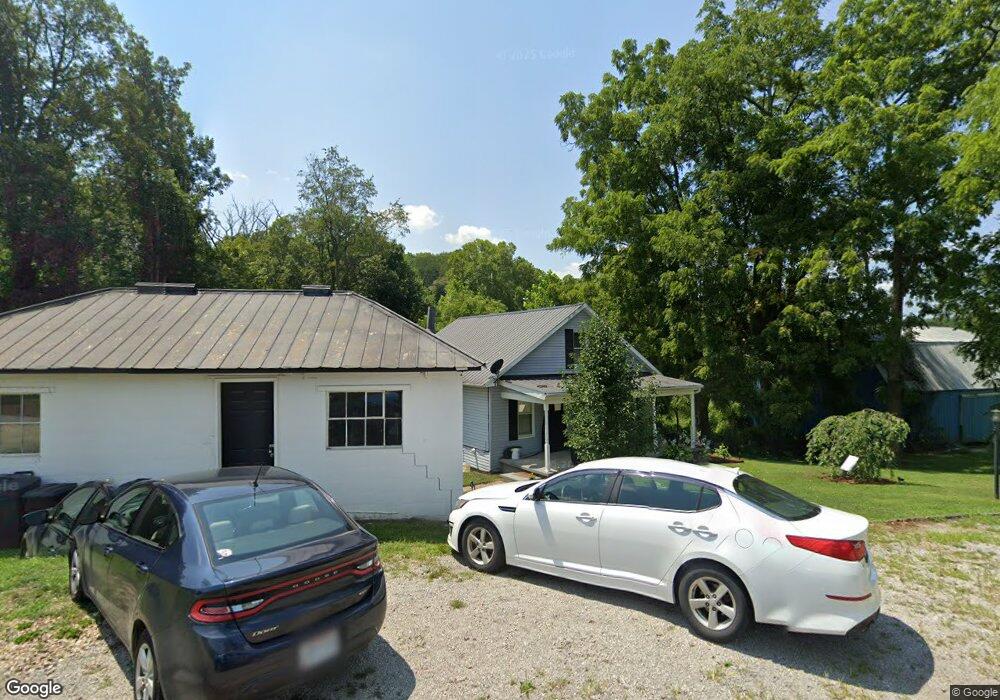
2560 Sour Run Rd Wellston, OH 45692
Estimated Value: $127,000 - $190,000
3
Beds
2
Baths
1,456
Sq Ft
$112/Sq Ft
Est. Value
About This Home
This home is located at 2560 Sour Run Rd, Wellston, OH 45692 and is currently estimated at $162,426, approximately $111 per square foot. 2560 Sour Run Rd is a home located in Jackson County with nearby schools including Jackson High School.
Ownership History
Date
Name
Owned For
Owner Type
Purchase Details
Closed on
May 8, 2025
Sold by
Allen Paul Andrew
Bought by
Allen Paul Andrew and Davis Kendra Ann
Current Estimated Value
Purchase Details
Closed on
Sep 10, 2024
Sold by
Davis Kendra A
Bought by
Allen Paul A
Home Financials for this Owner
Home Financials are based on the most recent Mortgage that was taken out on this home.
Original Mortgage
$157,102
Interest Rate
6.73%
Mortgage Type
New Conventional
Purchase Details
Closed on
Sep 18, 2015
Sold by
Raber Tiffany
Bought by
Davis Kendra A
Home Financials for this Owner
Home Financials are based on the most recent Mortgage that was taken out on this home.
Original Mortgage
$97,697
Interest Rate
4.75%
Mortgage Type
FHA
Purchase Details
Closed on
Feb 9, 2015
Sold by
Cosby Christopher R
Bought by
Raber Tiffany
Purchase Details
Closed on
Sep 27, 1999
Sold by
Cosby Laurel E
Bought by
Perry Debbie E
Purchase Details
Closed on
Aug 31, 1995
Sold by
Cosby Laurel E
Bought by
Cosby Laurel E
Create a Home Valuation Report for This Property
The Home Valuation Report is an in-depth analysis detailing your home's value as well as a comparison with similar homes in the area
Home Values in the Area
Average Home Value in this Area
Purchase History
| Date | Buyer | Sale Price | Title Company |
|---|---|---|---|
| Allen Paul Andrew | -- | None Listed On Document | |
| Allen Paul A | $160,000 | Northwest Title | |
| Davis Kendra A | $99,500 | Northwest Title | |
| Raber Tiffany | -- | None Available | |
| Perry Debbie E | $99,000 | -- | |
| Cosby Laurel E | -- | -- |
Source: Public Records
Mortgage History
| Date | Status | Borrower | Loan Amount |
|---|---|---|---|
| Previous Owner | Allen Paul A | $157,102 | |
| Previous Owner | Davis Kendra A | $97,697 |
Source: Public Records
Tax History Compared to Growth
Tax History
| Year | Tax Paid | Tax Assessment Tax Assessment Total Assessment is a certain percentage of the fair market value that is determined by local assessors to be the total taxable value of land and additions on the property. | Land | Improvement |
|---|---|---|---|---|
| 2024 | $1,149 | $33,580 | $1,930 | $31,650 |
| 2023 | $1,171 | $33,580 | $1,930 | $31,650 |
| 2022 | $1,222 | $25,720 | $2,660 | $23,060 |
| 2021 | $959 | $25,720 | $2,660 | $23,060 |
| 2020 | $965 | $25,720 | $2,660 | $23,060 |
| 2019 | $882 | $23,160 | $2,390 | $20,770 |
| 2018 | $848 | $23,160 | $2,390 | $20,770 |
| 2017 | $701 | $23,160 | $2,390 | $20,770 |
| 2016 | $593 | $16,830 | $690 | $16,140 |
| 2015 | $614 | $16,830 | $690 | $16,140 |
| 2013 | $583 | $16,070 | $690 | $15,380 |
| 2012 | $592 | $16,070 | $690 | $15,380 |
Source: Public Records
Map
Nearby Homes
- 0 Meacham Rd
- 0 Raysville Rd
- 3732 Borland Rd
- 0 Erwin Hollow Rd
- 19338 Ohio 327
- 1882 Oakland Rd
- 0 U S 35
- 0 Oakland Rd Unit 24343871
- 82 Main St
- 3988 W St Rt 35
- 55 Cain Rd
- 56400 Doles Rd
- 587 John W Barbee Rd
- 1587 St Rt 35
- 523 Oakland Rd
- 522 Hard Scrapple Rd
- 19490 Ohio 93
- 2441 Valley Chapel Rd
- 2248 McCune Cemetery Rd
- 998 Lake Katharine Rd
- 2490 Sour Run Rd
- 4699 Raysville Rd
- 4938 Raysville Rd
- 4701 Raysville Rd
- 4960 Raysville Rd
- 2372 Sour Run Rd
- 4961 Raysville Rd
- 2805 Sour Run Rd
- 228 Park Rd
- 2909 Sour Run Rd
- 5042 Raysville Rd
- 2132 Sour Run Rd
- 1889 Raysville Rd
- 4276 Raysville Rd
- 0 Sour Run Rd Unit 1772325
- 0 Sour Run Rd
- 4309 Raysville Rd
- 5375 Raysville Rd
- 346 Glade Run Rd
- 1957 Sour Run Rd