Estimated Value: $194,000 - $244,000
4
Beds
2
Baths
2,000
Sq Ft
$106/Sq Ft
Est. Value
About This Home
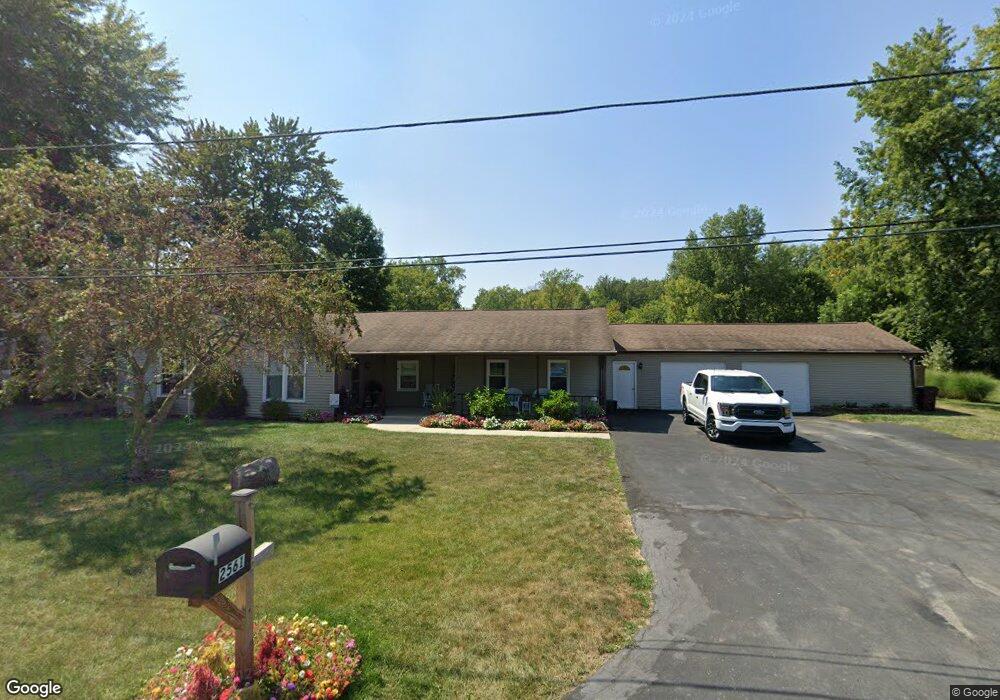
This home is located at 2561 Burch Ave, Lima, OH 45801 and is currently estimated at $212,496, approximately $106 per square foot. 2561 Burch Ave is a home located in Allen County with nearby schools including Elida Elementary School, Elida Middle School, and Elida High School.
Ownership History
Date
Name
Owned For
Owner Type
Purchase Details
Closed on
Sep 20, 2006
Sold by
Haggard David B and Haggard Susan L
Bought by
Shipman Thomas D and Shipman Francesca
Current Estimated Value
Home Financials for this Owner
Home Financials are based on the most recent Mortgage that was taken out on this home.
Original Mortgage
$100,000
Outstanding Balance
$59,463
Interest Rate
6.49%
Mortgage Type
Purchase Money Mortgage
Estimated Equity
$153,033
Purchase Details
Closed on
Jun 20, 1995
Sold by
Dickason Oren
Bought by
Haggard David
Home Financials for this Owner
Home Financials are based on the most recent Mortgage that was taken out on this home.
Original Mortgage
$23,200
Interest Rate
8.27%
Mortgage Type
New Conventional
Purchase Details
Closed on
Jul 2, 1993
Sold by
Burke Wilbur A
Bought by
Dickason Oren E
Purchase Details
Closed on
Mar 4, 1987
Bought by
Burke Wilbur A
Create a Home Valuation Report for This Property
The Home Valuation Report is an in-depth analysis detailing your home's value as well as a comparison with similar homes in the area
Purchase History
| Date | Buyer | Sale Price | Title Company |
|---|---|---|---|
| Shipman Thomas D | $128,000 | None Available | |
| Haggard David | $28,000 | -- | |
| Dickason Oren E | $17,000 | -- | |
| Burke Wilbur A | -- | -- |
Source: Public Records
Mortgage History
| Date | Status | Borrower | Loan Amount |
|---|---|---|---|
| Open | Shipman Thomas D | $100,000 | |
| Previous Owner | Haggard David | $23,200 |
Source: Public Records
Tax History
| Year | Tax Paid | Tax Assessment Tax Assessment Total Assessment is a certain percentage of the fair market value that is determined by local assessors to be the total taxable value of land and additions on the property. | Land | Improvement |
|---|---|---|---|---|
| 2024 | $2,796 | $57,820 | $5,180 | $52,640 |
| 2023 | $2,753 | $55,060 | $4,940 | $50,120 |
| 2022 | $2,802 | $55,060 | $4,940 | $50,120 |
| 2021 | $2,756 | $55,060 | $4,940 | $50,120 |
| 2020 | $2,557 | $47,430 | $5,640 | $41,790 |
| 2019 | $2,557 | $47,430 | $5,640 | $41,790 |
| 2018 | $2,579 | $47,430 | $5,640 | $41,790 |
| 2017 | $2,579 | $43,620 | $5,640 | $37,980 |
| 2016 | $2,577 | $43,620 | $5,640 | $37,980 |
| 2015 | $2,277 | $43,620 | $5,640 | $37,980 |
| 2014 | $2,277 | $36,440 | $5,430 | $31,010 |
| 2013 | $2,075 | $36,440 | $5,430 | $31,010 |
Source: Public Records
Map
Nearby Homes
- 520 Kenmore St
- 475 Kenmore St
- 3137 Thorndyke Dr
- 0 Thorndyke Dr
- 2371 Mandolin Dr
- 1014 Brower Rd
- 2300 Mandolin Dr
- 1705 Karen St
- 2718 Carolyn Dr
- 2630 Carolyn Dr
- 207 W Lane Ave
- 1317 Virginia Ave
- 1889 N Metcalf St
- 1743 Sherry Lee Dr
- 1212 Virginia Ave
- 1435 N Central Ave
- 2113 Kimberly Dr
- 1164 Bahama Dr
- 608 W O'Connor Ave
- 2129 Reinell Ave
Your Personal Tour Guide
Ask me questions while you tour the home.