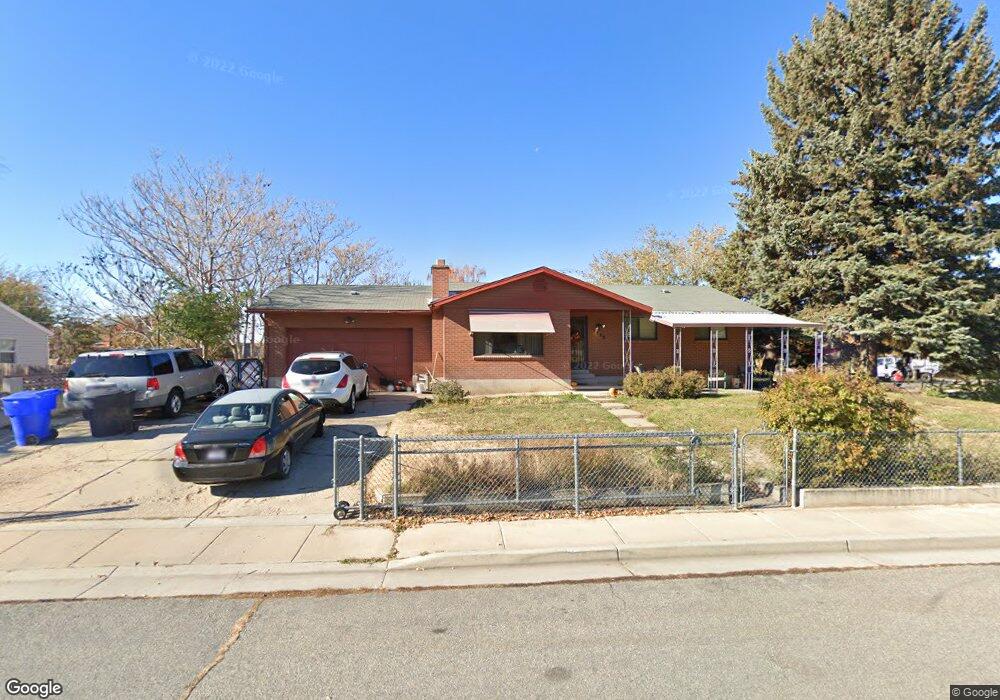
2561 N 350 W Clearfield, UT 84015
Estimated Value: $383,000 - $422,061
4
Beds
2
Baths
2,364
Sq Ft
$168/Sq Ft
Est. Value
About This Home
This home is located at 2561 N 350 W, Clearfield, UT 84015 and is currently estimated at $396,765, approximately $167 per square foot. 2561 N 350 W is a home located in Davis County with nearby schools including Fremont School, Sunset Junior High School, and Northridge High School.
Ownership History
Date
Name
Owned For
Owner Type
Purchase Details
Closed on
Nov 10, 2014
Sold by
Nufrio Joshua V
Bought by
Nufrio Joshua and Nufrio Amanda
Current Estimated Value
Home Financials for this Owner
Home Financials are based on the most recent Mortgage that was taken out on this home.
Original Mortgage
$126,750
Outstanding Balance
$97,386
Interest Rate
4.16%
Mortgage Type
New Conventional
Estimated Equity
$299,379
Purchase Details
Closed on
Oct 24, 2011
Sold by
Penttila Sonja G
Bought by
Balster Luke and Balster Lene
Home Financials for this Owner
Home Financials are based on the most recent Mortgage that was taken out on this home.
Original Mortgage
$108,000
Interest Rate
4.05%
Mortgage Type
Seller Take Back
Purchase Details
Closed on
Feb 17, 1998
Sold by
Boynton Lewis R and Penttila Sonja G
Bought by
Penttila Sonja G
Create a Home Valuation Report for This Property
The Home Valuation Report is an in-depth analysis detailing your home's value as well as a comparison with similar homes in the area
Home Values in the Area
Average Home Value in this Area
Purchase History
| Date | Buyer | Sale Price | Title Company |
|---|---|---|---|
| Nufrio Joshua | -- | Us Title Company Of | |
| Nufrio Joshua | -- | Us Title Company Of | |
| Balster Luke | -- | First American Title | |
| Penttila Sonja G | -- | -- |
Source: Public Records
Mortgage History
| Date | Status | Borrower | Loan Amount |
|---|---|---|---|
| Open | Nufrio Joshua | $126,750 | |
| Closed | Nufrio Joshua | $126,750 | |
| Previous Owner | Balster Luke | $108,000 |
Source: Public Records
Tax History
| Year | Tax Paid | Tax Assessment Tax Assessment Total Assessment is a certain percentage of the fair market value that is determined by local assessors to be the total taxable value of land and additions on the property. | Land | Improvement |
|---|---|---|---|---|
| 2025 | $2,400 | $218,900 | $74,999 | $143,901 |
| 2024 | $2,182 | $199,100 | $71,654 | $127,446 |
| 2023 | $2,044 | $340,000 | $114,014 | $225,986 |
| 2022 | $2,193 | $197,450 | $64,773 | $132,677 |
| 2021 | $1,894 | $268,000 | $72,100 | $195,900 |
| 2020 | $1,667 | $232,000 | $61,272 | $170,728 |
| 2019 | $1,570 | $224,000 | $74,034 | $149,966 |
| 2018 | $1,396 | $195,000 | $59,164 | $135,836 |
| 2016 | $1,170 | $83,985 | $27,992 | $55,993 |
| 2015 | $1,118 | $76,010 | $27,992 | $48,018 |
| 2014 | $1,009 | $70,122 | $28,121 | $42,001 |
| 2013 | -- | $64,933 | $23,265 | $41,668 |
Source: Public Records
Map
Nearby Homes
Your Personal Tour Guide
Ask me questions while you tour the home.