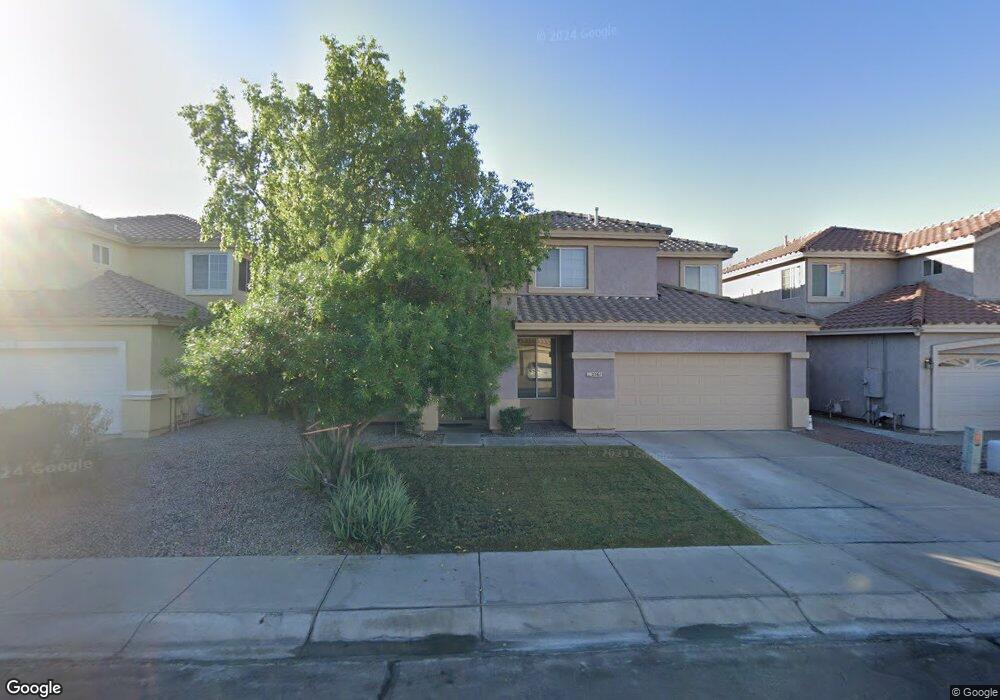
2561 W Megan St Chandler, AZ 85224
Central Ridge NeighborhoodEstimated Value: $477,372 - $660,000
--
Bed
4
Baths
2,009
Sq Ft
$292/Sq Ft
Est. Value
About This Home
This home is located at 2561 W Megan St, Chandler, AZ 85224 and is currently estimated at $586,593, approximately $291 per square foot. 2561 W Megan St is a home located in Maricopa County with nearby schools including Andersen Elementary School, Andersen Junior High School, and Chandler High School.
Ownership History
Date
Name
Owned For
Owner Type
Purchase Details
Closed on
Sep 19, 2012
Sold by
Ni Qing Xiao and Yang Lian Bao
Bought by
Ni Qing Xiao and Yang Lian Bao
Current Estimated Value
Home Financials for this Owner
Home Financials are based on the most recent Mortgage that was taken out on this home.
Original Mortgage
$168,000
Outstanding Balance
$27,686
Interest Rate
3.43%
Mortgage Type
New Conventional
Estimated Equity
$558,907
Purchase Details
Closed on
Mar 25, 1996
Sold by
The Forecast Group Lp
Bought by
Forecast Residential Sales Of Az Ltd Par
Home Financials for this Owner
Home Financials are based on the most recent Mortgage that was taken out on this home.
Original Mortgage
$110,800
Interest Rate
7.05%
Mortgage Type
New Conventional
Purchase Details
Closed on
Mar 19, 1996
Sold by
Forecast Residential Sales Of Az Ltd Par
Bought by
Ni Qing Ziao and Yang Lian Bao
Home Financials for this Owner
Home Financials are based on the most recent Mortgage that was taken out on this home.
Original Mortgage
$110,800
Interest Rate
7.05%
Mortgage Type
New Conventional
Create a Home Valuation Report for This Property
The Home Valuation Report is an in-depth analysis detailing your home's value as well as a comparison with similar homes in the area
Home Values in the Area
Average Home Value in this Area
Purchase History
| Date | Buyer | Sale Price | Title Company |
|---|---|---|---|
| Ni Qing Xiao | -- | Grand Canyon Title Agency In | |
| Forecast Residential Sales Of Az Ltd Par | -- | Fidelity Title | |
| Ni Qing Ziao | $138,527 | Fidelity Title |
Source: Public Records
Mortgage History
| Date | Status | Borrower | Loan Amount |
|---|---|---|---|
| Open | Ni Qing Xiao | $168,000 | |
| Closed | Ni Qing Ziao | $110,800 |
Source: Public Records
Tax History Compared to Growth
Tax History
| Year | Tax Paid | Tax Assessment Tax Assessment Total Assessment is a certain percentage of the fair market value that is determined by local assessors to be the total taxable value of land and additions on the property. | Land | Improvement |
|---|---|---|---|---|
| 2025 | $2,264 | $29,067 | -- | -- |
| 2024 | $2,187 | $27,683 | -- | -- |
| 2023 | $2,187 | $40,060 | $8,010 | $32,050 |
| 2022 | $2,110 | $30,950 | $6,190 | $24,760 |
| 2021 | $2,212 | $29,310 | $5,860 | $23,450 |
| 2020 | $2,202 | $27,000 | $5,400 | $21,600 |
| 2019 | $2,118 | $25,120 | $5,020 | $20,100 |
| 2018 | $2,051 | $24,410 | $4,880 | $19,530 |
| 2017 | $1,911 | $23,910 | $4,780 | $19,130 |
| 2016 | $1,841 | $24,150 | $4,830 | $19,320 |
| 2015 | $1,784 | $22,760 | $4,550 | $18,210 |
Source: Public Records
Map
Nearby Homes
- 2580 W Shannon Ct
- 2466 W Shannon St
- 2455 W Shannon St
- 2541 W Park Ave
- 2571 W Park Ave
- 2323 W Harrison St
- 810 N Los Altos Dr
- 2784 W Del Rio Place
- 601 N Bullmoose Dr
- 1367 N Los Altos Dr
- 700 N Dobson Rd Unit 11
- 855 N Dobson Rd Unit 2090
- 3151 W Frankfurt Dr
- 3111 W Baylor Ln
- 2609 W Upland Dr
- 991 N Florence Dr
- 2117 W Tyson St
- 2725 W Flint St
- 2221 W Rockwell Dr
- 1825 W Ray Rd Unit 1008
- 2571 W Megan St
- 2551 W Megan St
- 2554 W Raintree Way
- 2581 W Megan St
- 2564 W Raintree Way
- 2560 W Megan St
- 2584 W Raintree Way
- 2550 W Megan St
- 2591 W Megan St
- 2570 W Megan St
- 2574 W Raintree Way
- 2580 W Megan St
- 2439 W Megan St
- 2601 W Megan St
- 2440 W Megan St
- 2590 W Megan St
- 2594 W Raintree Way
- 2429 W Megan St
- 2611 W Megan St
- 2600 W Megan St