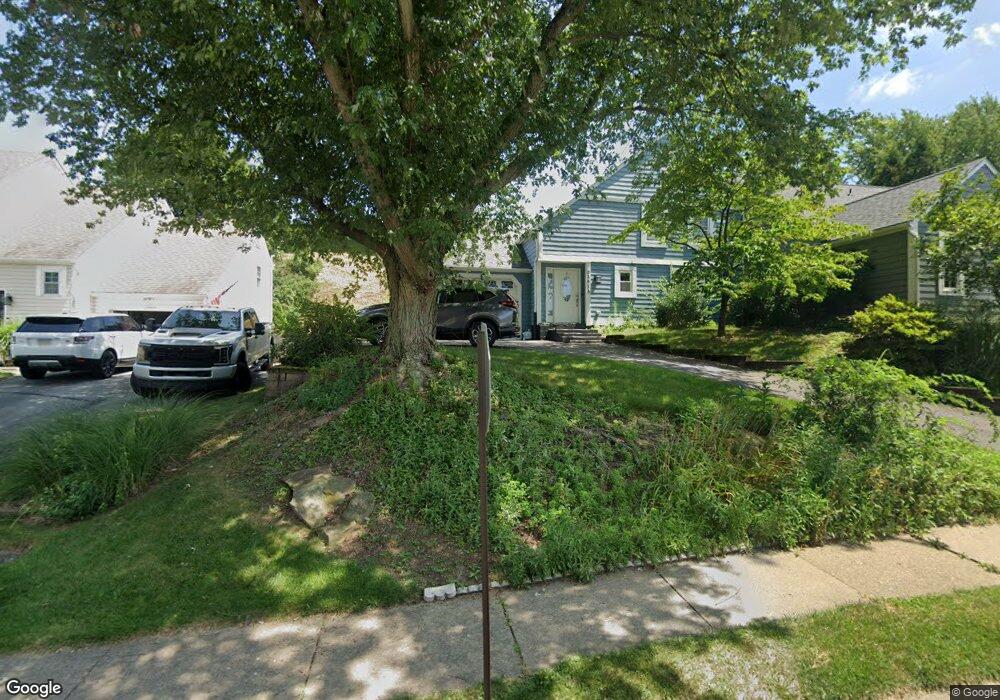
2561A Pheasant Run Dr Unit 27 Wexford, PA 15090
Estimated Value: $306,000 - $339,000
3
Beds
2
Baths
1,556
Sq Ft
$212/Sq Ft
Est. Value
About This Home
This home is located at 2561A Pheasant Run Dr Unit 27, Wexford, PA 15090 and is currently estimated at $329,318, approximately $211 per square foot. 2561A Pheasant Run Dr Unit 27 is a home located in Allegheny County with nearby schools including Franklin Elementary School, Marshall Middle School, and North Allegheny High School.
Ownership History
Date
Name
Owned For
Owner Type
Purchase Details
Closed on
Apr 17, 2020
Sold by
Roman Francis M
Bought by
Fisher Renee Joy
Current Estimated Value
Home Financials for this Owner
Home Financials are based on the most recent Mortgage that was taken out on this home.
Original Mortgage
$202,215
Outstanding Balance
$178,798
Interest Rate
3.3%
Mortgage Type
New Conventional
Estimated Equity
$150,520
Purchase Details
Closed on
Jul 31, 2017
Sold by
Roman Francis M
Bought by
Roman Francis M
Purchase Details
Closed on
Aug 31, 2010
Sold by
Stimmel Julie L and Stimmel Richard W
Bought by
Roman Francis M
Home Financials for this Owner
Home Financials are based on the most recent Mortgage that was taken out on this home.
Original Mortgage
$176,600
Interest Rate
4.55%
Mortgage Type
FHA
Purchase Details
Closed on
May 11, 2001
Sold by
Jones Jeffrey C and Jones Terri A
Bought by
Keller John M
Create a Home Valuation Report for This Property
The Home Valuation Report is an in-depth analysis detailing your home's value as well as a comparison with similar homes in the area
Home Values in the Area
Average Home Value in this Area
Purchase History
| Date | Buyer | Sale Price | Title Company |
|---|---|---|---|
| Fisher Renee Joy | $237,900 | Brokers Settlement Services | |
| Roman Francis M | -- | None Available | |
| Roman Francis M | $179,000 | -- | |
| Keller John M | $125,500 | -- |
Source: Public Records
Mortgage History
| Date | Status | Borrower | Loan Amount |
|---|---|---|---|
| Open | Fisher Renee Joy | $202,215 | |
| Previous Owner | Roman Francis M | $176,600 |
Source: Public Records
Tax History Compared to Growth
Tax History
| Year | Tax Paid | Tax Assessment Tax Assessment Total Assessment is a certain percentage of the fair market value that is determined by local assessors to be the total taxable value of land and additions on the property. | Land | Improvement |
|---|---|---|---|---|
| 2025 | $4,900 | $190,200 | -- | $190,200 |
| 2024 | $4,900 | $190,200 | -- | $190,200 |
| 2023 | $4,900 | $190,200 | $0 | $190,200 |
| 2022 | $5,238 | $208,200 | $0 | $208,200 |
| 2021 | $744 | $208,200 | $0 | $208,200 |
| 2020 | $3,505 | $157,300 | $0 | $157,300 |
| 2019 | $3,409 | $139,300 | $0 | $139,300 |
| 2018 | $3,346 | $139,300 | $0 | $139,300 |
| 2017 | $3,346 | $139,300 | $0 | $139,300 |
| 2016 | $659 | $139,300 | $0 | $139,300 |
| 2015 | $659 | $139,300 | $0 | $139,300 |
| 2014 | $3,233 | $139,300 | $0 | $139,300 |
Source: Public Records
Map
Nearby Homes
- 2569 Pheasant Run Dr Unit B
- 2582 Grouse Ridge Unit A
- 2568 Grouse Ridge Unit A
- 2543 Derby Ct
- 2529 Brandt School Rd
- 2561 Barnwood Dr
- 2529 Riva Ridge Ct
- 2524 Brandt School Rd
- 1737 Waterleaf Dr
- 1468 Laurel Dr
- 1715 Waterleaf Dr
- 2516 Nicholson Rd
- 2529 Adele Ct
- 2668 Timberglen Dr W
- 2696 Timberglen Dr
- 2117 Huntington Ct S
- 2460 Nicholson Rd
- Carlisle Plan at Deerfield Estates
- Waterloo Plan at Deerfield Estates
- Somerset Plan at Deerfield Estates
- 2561A Pheasant Run
- 2561B Pheasant Run
- 2559B Pheasant Run
- 2559 Pheasant Run Dr Unit B
- 2563A Pheasant Run
- 2563 Pheasant Run Dr Unit A
- 2563B Pheasant Run
- 2566A Pheasant Run
- 2566B Pheasant Run
- 2557b Pheasant Run
- 2557 Pheasant Run Unit A
- 2557 Pheasant Run
- 2565A Pheasant Run Dr
- 2568B Pheasant Run Dr Unit 107
- 2570A Pheasant Run
- 2562B Pheasant Run Dr Unit 113
- 2557a Pheasant Run
- 2570 Pheasant Run
- 2570B Pheasant Run
- 2562A Pheasant Run Dr Unit 114